Churn kills growth. In SaaS, churn - the percentage of customers who cancel their subscriptions - directly impacts critical metrics like customer lifetime value (LTV), customer acquisition cost (CAC), and monthly recurring revenue (MRR). Even a small reduction in churn can lead to massive financial improvements.
Here’s the bottom line:
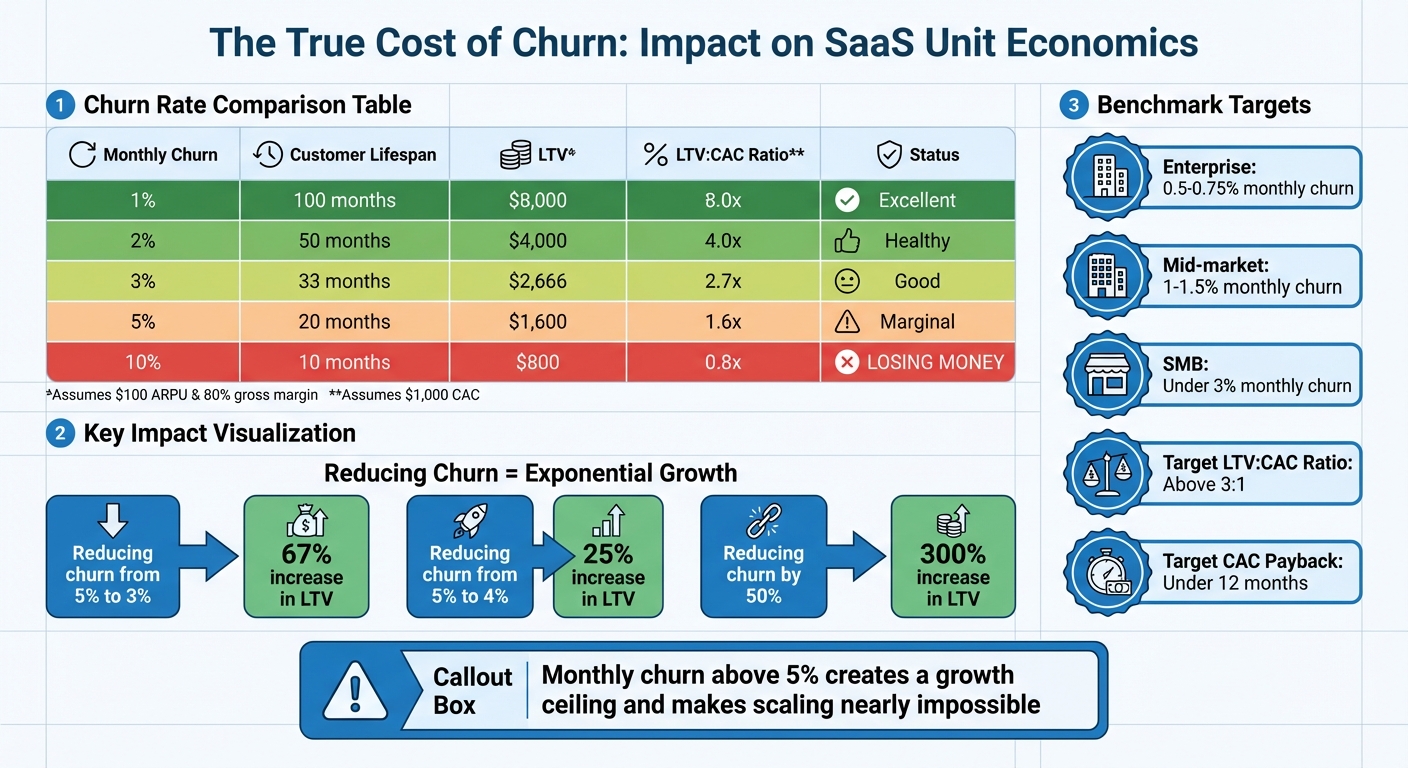
- Lower churn boosts LTV. For example, reducing churn from 5% to 3% can increase LTV by 67%.
- High churn wastes your CAC. If customers leave before covering acquisition costs, profitability becomes impossible.
- Churn limits growth. Monthly churn above 5% creates a ceiling, making it harder to scale.
To reduce churn, focus on better onboarding, tracking customer behavior, and addressing at-risk accounts early. Tools that provide real-time financial insights can help you spot problems before they escalate.
This article covers how churn affects SaaS metrics, the financial impact, and actionable strategies to improve retention and stabilize revenue.
SAAS Metrics- Revenue Churn + NRR | Venture Capitalist Explains
sbb-itb-17e8ec9
How Churn Affects Core SaaS Metrics
How Churn Rate Impacts SaaS Customer Lifetime Value and Profitability
Churn isn’t just a standalone problem - it’s a domino that impacts nearly every critical SaaS metric. Understanding how churn connects to these metrics highlights why keeping customers is just as important as bringing in new ones.
Customer Lifetime Value (LTV)
Churn plays a key role in determining how long customers stick around and, by extension, their lifetime value. You can calculate a customer's average lifespan using the formula: 1 ÷ churn rate. For instance, a 2% churn rate gives you 50 months, while a 5% churn rate cuts that down to just 20 months.
The financial impact of churn reduction is massive. Lowering churn from 5% to 4% increases LTV by 25%. Drop it from 5% to 3%, and you’re looking at a 67% increase in LTV. Even a small 2% improvement in monthly churn can lead to a 40% to 70% boost in LTV.
| Monthly Churn Rate | Avg. Customer Lifespan | LTV (assuming $100 ARPU & 80% gross margin) |
|---|---|---|
| 1% | 100 months | $8,000 |
| 2% | 50 months | $4,000 |
| 3% | 33.3 months | $2,666 |
| 5% | 20 months | $1,600 |
| 10% | 10 months | $800 |
When calculating LTV, use gross margin (revenue minus cost of goods sold) rather than total revenue. This avoids inflating a customer’s value. SaaS companies generally aim for gross margins between 70% and 85%. Also, ensure customers stay longer than your CAC (Customer Acquisition Cost) payback period. For B2B SaaS, this period should ideally be under 12 months.
Lower LTV makes it harder to recover your CAC, which ties directly into the next metric.
Customer Acquisition Cost (CAC)
High churn means your marketing dollars are spent replacing lost customers instead of growing your user base. This turns growth efforts into a game of catch-up.
The CAC Payback Period measures how long it takes to recover the cost of acquiring a customer. If customers churn before this period ends (typically 6–12 months), your acquisition efforts become unprofitable. When churn lowers LTV, it also reduces your LTV:CAC ratio. A healthy ratio is above 3:1, while anything below 1:1 means you’re losing money on every customer.
Here’s the reality: the average B2B SaaS company spends $1,200 to acquire a customer, with acquisition costs expected to rise by 14% through 2025. Currently, the median SaaS business spends $2.00 to generate $1.00 in new ARR (Annual Recurring Revenue). This squeeze on efficiency has contributed to 966 U.S. startup closures in 2024, where churn outpaced acquisition efforts, leading to unsustainable economics.
"If you're still obsessing over new customer acquisition while existing customers quietly churn, you're building on quicksand."
– Jessica Hamilton, Writer, WeAreFounders
Reducing churn from 10% to 5% doubles customer LTV, making your CAC investment much easier to justify.
Monthly Recurring Revenue (MRR)
Churn doesn’t just hurt LTV and CAC - it also eats into your Monthly Recurring Revenue (MRR). When customers leave, they take their subscription dollars with them, forcing you to replace that lost revenue with new MRR just to break even. Over time, this can lead to a growth stall, where churned revenue cancels out new revenue gains.
The Quick Ratio - calculated as (New + Expansion MRR) ÷ (Churned + Contraction MRR) - helps measure this balance. A ratio above 4 signals healthy growth. On the flip side, churn rates above 5% make it tough to achieve sustainable growth.
"The churn rate, combined with the rate of new ARR adds, not only defines how fast you can grow the business, it also defines the maximum size the business can reach."
– Ron Gill, Former CFO, NetSuite
Top-performing B2B SaaS companies achieve 115%–125% net revenue retention, meaning expansion revenue from existing customers outweighs losses from churn. This "negative churn" turns what could be a leaky bucket into a source of growth. Additionally, improving retention by just 5% can increase long-term valuation by 25% to 95%.
Calculating the Financial Impact of Churn
Understanding churn rates helps you see how they ripple through customer lifespan and profitability.
Comparing Different Churn Rate Scenarios
The connection between churn and customer lifetime value (LTV) is not linear - it’s exponential. Because churn sits in the denominator of the LTV formula, even small changes can lead to dramatic shifts in value. Let’s break it down: if churn is 2%, the LTV is $4,000; at 4%, it drops to $2,000; and at 6%, it plummets to about $1,333. These calculations assume an average revenue per user (ARPU) of $100 and an 80% gross margin.
| Monthly Churn Rate | Customer Lifetime | LTV (at $100 ARPU, 80% margin) | LTV:CAC Ratio (at $1,000 CAC) |
|---|---|---|---|
| 2% | 50 months | $4,000 | 4.0x (Healthy) |
| 4% | 25 months | $2,000 | 2.0x (Marginal) |
| 6% | 16.6 months | $1,333 | 1.3x (Critical) |
| 10% | 10 months | $800 | 0.8x (Losing money) |
This table highlights why keeping churn below 5% is so important for profitability. At 10% churn, the LTV:CAC ratio drops below 1.0x, meaning the company is losing money on every customer after factoring in acquisition costs.
But averages only tell part of the story. Digging deeper into churn by cohorts and segments can reveal the most critical issues.
Cohort and Segment Analysis
Cohort analysis helps pinpoint when and where churn hits hardest. Aggregate churn numbers can hide specific trends, but tracking cohorts - groups of customers based on their sign-up date - uncovers when customers are most likely to leave. For instance, many SaaS businesses see the steepest churn within the first 30 days. This often points to onboarding or activation challenges. On the flip side, customers who stay active beyond 90 days tend to have stronger long-term retention.
Segment analysis adds another layer by examining churn across different customer groups. For example, customers acquired through paid ads may churn at 8% monthly, while those acquired through organic search have a much lower churn rate of 3%. This translates to a 2.6x higher LTV for organic customers. You can also analyze churn by customer size (e.g., SMB vs. Enterprise) or pricing tiers. If your SMB segment has a CAC payback period of over 18 months and churns at 5% monthly, it’s a red flag for profitability.
When calculating churn metrics, it’s best to exclude trial-period cancellations. The first successful billing cycle marks the true start of the customer relationship. Additionally, consider labeling users as "churned" if they’ve been inactive for 90 consecutive days, even if they haven’t officially canceled. This method, borrowed from telecom standards, gives a clearer picture of active, paying customers. Armed with these insights, you can implement targeted strategies to reduce churn and improve the economics of your business.
How to Reduce Churn and Improve Unit Economics
Reducing churn is essential for stabilizing revenue, increasing lifetime value (LTV), and improving unit economics. Building on the earlier discussion of churn's impact on LTV, customer acquisition cost (CAC), and monthly recurring revenue (MRR), here are some practical strategies to tackle churn effectively.
Improving Customer Retention
Speeding up customer activation is a key step in reducing churn. Tools like contextual in-app guidance, checklists, and personalized walkthroughs help shorten the time it takes for customers to realize value from your product. Many SaaS companies face their highest churn rates within the first 30 days due to onboarding challenges. Interestingly, companies with activation rates above 35% tend to achieve higher valuation multiples compared to those with rates below 25%.
After onboarding, focus on driving adoption of product features that are linked to long-term retention. These "stickiness metrics" are specific customer behaviors that indicate a likelihood to stay. For example, HubSpot developed a predictive churn model by identifying key features tied to retention and assigning weighted engagement scores. This allowed them to implement proactive interventions when needed.
Proactive customer success is another critical factor. Instead of waiting for customers to reach out with issues, use health scores and regular check-ins to identify and address at-risk accounts early. To combat involuntary churn, implement tools like smart retry logic for failed payments, automated reminders for expiring cards, and subscription "pausing" options. These strategies can help prevent silent revenue loss caused by payment issues.
Growing Revenue Through Upselling and Cross-Selling
Retention secures your customer base, but upselling and cross-selling unlock additional revenue from those relationships. These strategies increase average revenue per user (ARPU) and LTV. Since LTV is calculated by multiplying ARPU by gross margin and customer lifespan, even small revenue expansions can significantly boost overall value. Plus, expanding existing accounts is far less expensive than acquiring new ones, improving your LTV:CAC ratio.
Consider offering premium add-ons that customers can purchase separately from their main subscription. Usage-based pricing is another option, allowing revenue to grow automatically as customers use your product more. Annual billing discounts can also secure upfront revenue while improving LTV. By tracking expansion MRR separately, you can identify which customer segments are most open to upselling. Combining a 50% reduction in churn with effective expansion strategies could lead to a 300% increase in customer lifetime value.
Using Real-Time Financial Data
Access to real-time financial data is a game changer for managing churn. By monitoring engagement with "sticky" product features and tracking metrics like net revenue retention (NRR), you can create customer engagement scores. These scores help forecast churn risk and allow customer success teams to prioritize at-risk accounts for early intervention.
For example, Lucid Financials offers AI-driven, real-time insights - accessible via Slack - that help founders monitor churn and unit economics. It provides automated forecasts and investor-ready reports based on live data, making it easier to spot trends like increased payment failures, declining expansion revenue, or changes in customer behavior. This level of visibility helps businesses make data-driven decisions about retention investments, pricing adjustments, and billing optimizations to reduce churn. When your financial data is up-to-date and actionable, you can allocate resources more effectively and focus on strategies that deliver the best ROI for retention efforts.
Tracking Churn Metrics
Once you've implemented strategies to reduce churn, the next step is to keep an eye on the numbers. Regularly tracking key metrics helps confirm your progress and ensures you're prepared with investor-friendly data at all times. These metrics serve as a reality check for how well your churn-reduction efforts are working.
Key Metrics to Monitor
Start with customer churn, a crucial metric that directly impacts Customer Lifetime Value (LTV). To calculate LTV, use this formula: average revenue per customer (ARPC) ÷ customer churn rate or alternatively, ARPC × average customer lifetime.
Another important figure is Customer Acquisition Cost (CAC), which you can calculate by dividing total sales and marketing expenses by the number of new customers acquired. To gauge efficiency, compare the LTV-to-CAC ratio, aiming for a target of 3:1. A 1:1 ratio suggests you're just breaking even, while a 6:1 ratio might indicate you're not investing enough in marketing.
The CAC payback period is another critical metric - this is the time it takes to recover acquisition costs, and the average benchmark is around 15 months. Ruben Gamez, Founder of BidSketch, highlights its importance:
"When it comes to profitability and whether a business model will work, I prefer to focus on payback period over LTV:CAC ratio. That means, how many months does it take for us to start making money from each customer. My target is typically 2 to 4 months."
Lastly, keep an eye on net revenue retention (NRR) to measure the impact of upselling and cross-selling. Comparing these metrics against industry standards will give you a clearer picture of your performance.
Industry Benchmarks
Tracking your internal metrics is essential, but benchmarking them against industry standards gives you a broader perspective. For SaaS companies, an annual churn rate between 5% and 7% is considered healthy, while monthly churn rates above 10% could signal major retention issues. To boost your company valuation, aim for a gross monthly churn rate of 2% or less, which equates to retaining customers for 50 months or more.
Alexander Bruehl, Founder of SaaS Garage, underscores the importance of monitoring gross MRR churn:
"If the Gross MRR Churn is above 1-2% there seems to be an issue with the product or the ROI story."
Steli Efti, CEO of Close.io, adds another layer of insight:
"Revenue churn can be drastically different than customer churn, and will often tell a completely different story."
Benchmarking not only validates your efforts but also ensures you're aligned with proven practices for strong SaaS unit economics. To streamline this process, integrate your CRM, billing, and customer success data into a unified system. This eliminates manual errors and provides a single source of truth. Tools like Lucid Financials make this easier by syncing live financial data and generating investor-ready reports in real time, allowing you to track churn metrics alongside broader unit economics without juggling multiple platforms.
Conclusion
Churn plays a critical role in shaping your SaaS financial model. Cutting churn extends customer lifetime, which boosts LTV, enhances CAC efficiency, and stabilizes MRR. For example, slashing churn by 50% can lead to a 300% increase in LTV.
This improvement sets off a chain reaction across your financial metrics. Lower churn allows for higher acquisition spending while keeping unit economics in check. It shortens your CAC payback period, strengthens cash flow, and helps you escape the expensive loop of replacing lost revenue. As Jason Lemkin, Founder of SaaStr, aptly states:
"Unit economics are the truth serum for SaaS businesses. You can have beautiful growth charts... but if you're spending $15,000 to acquire customers who only generate $12,000 in lifetime value, you're building a Ponzi scheme".
To fully capitalize on these benefits, real-time financial insights are essential. Real-time visibility turns guesswork into certainty. When you track churn alongside LTV, CAC payback, and NRR in one integrated system, you can identify and address issues before they escalate. Tools like Lucid Financials streamline this process by syncing live data from billing, CRM, and operations systems, delivering investor-grade reports without the hassle of manual spreadsheets or missing data.
Key benchmarks to aim for include 0.5%–0.75% monthly churn for Enterprise, 1%–1.5% for Mid-market, and under 3% for SMB. Strive for an LTV:CAC ratio above 3:1 and a CAC payback period of less than 12 months. These metrics aren't just for show - they form the backbone of sustainable growth and are closely examined by investors during due diligence.
Achieving healthy unit economics takes effort. It demands consistent monitoring, timely action, and the right tools to turn raw numbers into actionable strategies. Whether you're gearing up for your next funding round or focused on building a profitable business, reducing churn is the key that unlocks long-term success.
FAQs
Should I track customer churn or revenue churn?
Tracking customer churn is crucial because it directly impacts essential SaaS metrics like Customer Acquisition Cost (CAC) and Lifetime Value (LTV). These metrics are key to understanding your company's profitability and growth potential. While revenue churn focuses on the financial aspect of losses, customer churn gives a sharper picture of retention and the long-term value of your customer base. By monitoring this, you can create better strategies to strengthen retention and improve your overall business economics.
How do I know if my churn makes CAC payback impossible?
To figure out if churn is making it impossible to recover your Customer Acquisition Cost (CAC), you need to compare your churn rate against your CAC and Lifetime Value (LTV). If your churn rate is too high, it can block your ability to recover CAC within a realistic timeframe, making payback out of reach. Reducing churn should be a priority to improve your unit economics and support steady growth.
What’s the fastest way to find where churn is coming from?
To figure out why customers are leaving, dive into your customer data to spot patterns or groups with higher churn rates. Break down your audience by factors like usage habits, contract duration, or demographics, and zero in on the segments where churn is most pronounced.
Another useful approach is cohort analysis, which helps you identify specific timeframes or behaviors that correlate with churn. By uncovering these insights, you can better understand where to focus your efforts to reduce customer turnover.