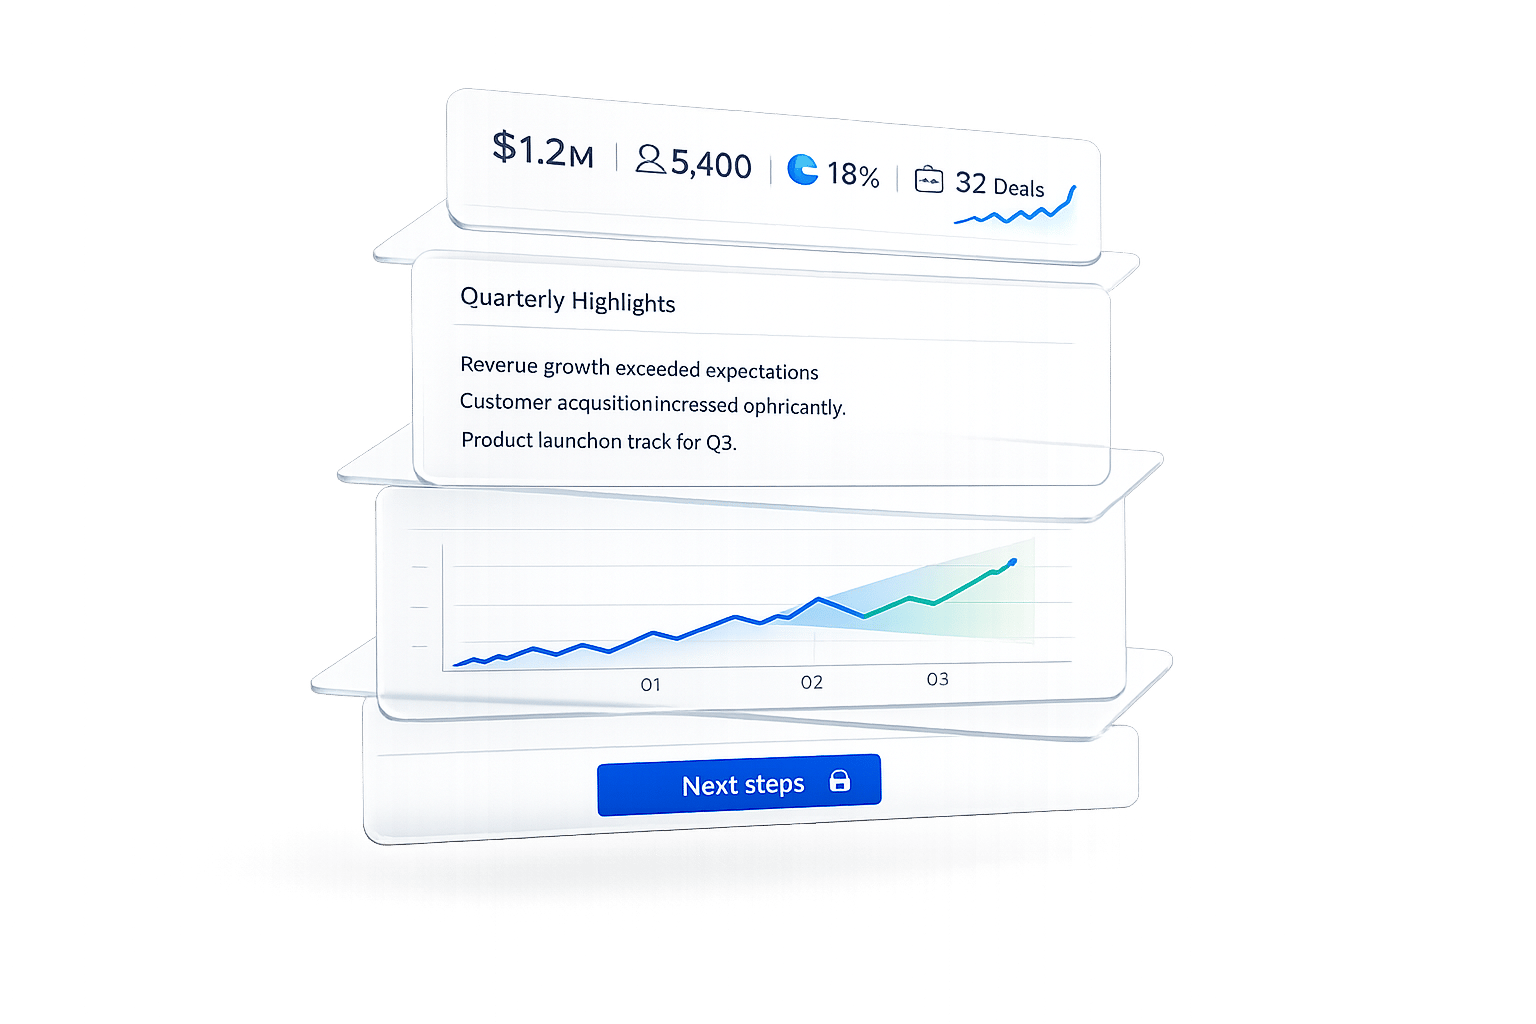
Behavioral segmentation is a game-changer for SaaS companies aiming to grow revenue. Instead of relying on demographics, it focuses on user actions - like feature engagement, login frequency, and clicks - to uncover what drives retention and conversions. Here's why it works:
- Boosts Retention: Behavioral insights can reduce churn by identifying warning signs early. For instance, PocketSuite cut churn by 30%.
- Increases Revenue: Tailored strategies based on user behavior improve metrics like conversion rates (+6% for Sur La Table) and Monthly Recurring Revenue (MRR) (+20% for Baremetrics).
- Personalized Experiences: Customers are 88% more likely to stay loyal to brands that personalize their experiences.
Real-world examples include:
- Sur La Table: Used browsing and purchase data to refine marketing, increasing product page views by 12%.
- PocketSuite: Focused onboarding based on user behavior, boosting engagement and retention.
- Beable: Differentiated content for students and educators, leading to a 77% rise in participation.
- Baremetrics: Identified high-value customers and adjusted strategies, achieving a 4.3% churn rate (below the 5% industry average).
- Statsig: Leveraged usage milestones and experimentation to help clients achieve profitability.
Behavioral segmentation works whether you're automating onboarding, refining product offerings, or targeting high-value users. Start by tracking key actions that lead to conversions and use that data to create dynamic user segments. The result? Better retention, higher engagement, and stronger revenue growth.
1. Sur La Table
Behavioral Segmentation Approach
Sur La Table, a specialty kitchenware retailer, created a complete customer profile by combining data from their POS system, e-commerce platform, and class registrations. This integration allowed them to understand customer behavior on a deeper level.
They introduced interest-based segmentation by analyzing specific culinary preferences, such as baking versus grilling, and brand choices like Le Creuset or Wüsthof. These insights were drawn directly from browsing habits and purchase data. To make this possible, Sur La Table used Heap (now part of Contentsquare), which automated event tracking. This system enabled them to segment customers based on product views, checkouts, and interactions with promotions. This detailed approach to segmentation played a key role in driving measurable growth in revenue.
Impact on Revenue Metrics
These refined customer segments became the foundation for more effective marketing strategies. By tailoring campaigns, they saw a 12% increase in product page views and a 6% rise in conversions through emails that directed users to relevant category pages.
Through funnel analysis, they uncovered a clear pattern: customers who viewed more products were not only more likely to make a purchase but also spent more per transaction. Acting on this, Sur La Table improved related-product displays to encourage co-purchases, which successfully increased the average order value. This case highlights the power of behavioral segmentation in boosting key revenue metrics.
Implementation Challenges
Despite these achievements, the journey wasn't without hurdles. Previously, rigid reporting systems and reliance on developers for tracking insights slowed their progress. However, the automatic data capture capabilities of their new platform removed these bottlenecks. This allowed the team to analyze customer behavior more efficiently, without waiting on technical support to make sense of the data.
2. PocketSuite
Behavioral Segmentation Approach
PocketSuite, a business management platform for service professionals, categorized its B2B users into two behavioral groups based on their professional experience. For seasoned professionals, the focus was on providing a streamlined onboarding process. On the other hand, newcomers required more comprehensive guidance to get started.
Using retroactive analysis through autocapture and virtual events, PocketSuite identified in-app behaviors that correlated with long-term user engagement - without needing to predefine tracking events. One standout finding was that early payment processing served as a strong predictor of user retention. This "Rising Star" milestone became a cornerstone of their segmentation strategy.
Impact on Revenue Metrics
By tailoring onboarding experiences and delivering targeted prompts, PocketSuite encouraged users to complete early high-value actions, reducing churn by 30%. This improvement had a direct and measurable impact on their revenue.
Behavioral insights also reshaped their product development process. Teams could now rely on real usage data, enabling quicker and more accurate feature rollouts that aligned with user needs.
Implementation Challenges
Before adopting behavioral segmentation, PocketSuite's teams struggled with incomplete data and often relied on assumptions to guide product decisions. Transitioning to a behavior-driven approach required rethinking their entire data collection and analysis process. Implementing tools capable of retroactively capturing user actions was a critical step in this transformation.
PocketSuite's success illustrates how behavioral segmentation can fuel both revenue growth and smarter product innovation - an approach that will be explored further in upcoming case studies.
3. Beable
Behavioral Segmentation Approach
Beable, a SaaS education platform, encountered a familiar challenge: catering to two vastly different user groups - students and educators - on the same platform. These groups had conflicting needs, making a universal approach ineffective.
To address this, Beable adopted the Jobs-to-be-Done (JTBD) framework. They monitored user behavior through page tagging and feature engagement, which helped them understand the self-study habits of students versus the workflow requirements of educators. This data revealed clear differences in how each group used the platform, emphasizing the importance of creating tailored content. This insight became the foundation for strategies aimed at driving revenue through personalization.
Impact on Revenue Metrics
Beable leveraged this segmentation to customize their in-app Resource Center, offering tutorials, FAQs, and tips tailored to each user group. They used funnel analysis and resource center analytics to identify which resources resonated most with each segment, refining their content based on these insights.
The results were impressive. In August 2025, Beable introduced targeted in-app surveys designed for specific behavioral segments. This led to a 77% increase in user participation. The boost in engagement directly contributed to improved retention and monetization - key drivers of long-term revenue growth. This approach mirrors the success seen in other SaaS companies, where behavioral segmentation enhances user loyalty and profitability.
Implementation Challenges
While the metrics showed success, Beable faced hurdles in ensuring content relevance. Their help resources initially struggled to meet the unique needs of each user group, which hindered engagement. To overcome this, they built a robust tracking infrastructure, tagging every relevant page and feature to gather actionable data. The challenge was ensuring this data provided meaningful insights rather than overwhelming noise, requiring careful planning and execution.
4. Baremetrics
Behavioral Segmentation Approach
Baremetrics, a subscription analytics platform, realized that relying on aggregate averages often masked the true drivers of revenue. To get a clearer picture, they segmented their data based on factors like plan size, product usage, and integration type. Through tracking 26 subscription metrics, they uncovered a key insight: 25% of their premium customers (those paying $200 or more per month) accounted for the majority of their Monthly Recurring Revenue (MRR). This discovery pushed Baremetrics to prioritize these high-value customer segments, leading to more targeted strategies and, ultimately, better revenue outcomes.
Impact on Revenue Metrics
By adopting a segmentation-driven approach, Baremetrics boosted their MRR by 20% in just one year. For instance, in August 2021, they analyzed their Canadian customer base and identified a troubling churn spike at the 3-month mark after offering a promotional package. These short-term users were dragging down long-term revenue. In response, Baremetrics eliminated the 3-month plan and introduced a 6-month minimum subscription. This change not only preserved revenue levels but also significantly cut operational costs.
Another valuable insight came from segmenting upgrade metrics by payment platform. They found that customers using Stripe were far more likely to upgrade compared to those on Shopify, Braintree, or Apple. With this data, Baremetrics was able to channel their R&D and sales efforts into high-conversion customer segments, maximizing their resources where it mattered most.
Implementation Challenges
Of course, the process wasn’t without its hurdles. Baremetrics had to confront the limitations of their data. As Clair Pacey, Founder of Baremetrics, explained:
"By only looking at averages, you might be missing something big, like a secret cash cow or massive budget waster".
While the overall 20% MRR growth was encouraging, segmentation revealed that not all customer groups performed equally - some segments flourished, while others lagged behind. This highlighted the importance of continuously refining their approach to ensure sustainable growth.
sbb-itb-17e8ec9
5. Statsig
Behavioral Segmentation Approach
Statsig, known for its experimentation and feature management platform, uses a three-part segmentation strategy: usage-based, occasion-based, and loyalty-driven. They categorize users into three groups - active, occasional, and at-risk - to deliver upgrade prompts at just the right moment, ensuring maximum engagement. By analyzing when users interact with the platform, they time these prompts to coincide with specific usage milestones. Additionally, Statsig identifies "power users", who frequently test new features and provide valuable feedback. This allows them to fine-tune pricing models to reflect the actual value experienced by these users. The result? A focused approach that directly contributes to revenue growth.
Impact on Revenue Metrics
This strategy has delivered impressive results. One company, after 16 years of operation, achieved profitability by utilizing Statsig's platform. Zachary Zaranka, Director of Product, highlighted this achievement:
"Leveraging experimentation with Statsig helped us reach profitability for the first time in our 16-year history."
Beyond profitability, companies report faster decision-making. The average time to finalize A/B tests has been reduced by 7 days, while data scientists save 3–5 days of manual effort for each feature launch.
Implementation Challenges
While effective, behavioral segmentation is not without its hurdles. Statsig recognizes that misinterpreting behavioral data can lead to flawed decisions and unexpected technical issues. When developing their AI assistant, Statbot, the team faced optimization challenges. They addressed these by combining rigorous offline testing with insights from real-world usage. This experience highlights that behavioral segmentation is a continuous process, requiring ongoing adjustments to keep up with evolving user behaviors.
Do I Need Cohort Analysis for My Revenue Streams? | SaaS Metrics School | Cohort Analysis
Comparison: Strengths and Weaknesses
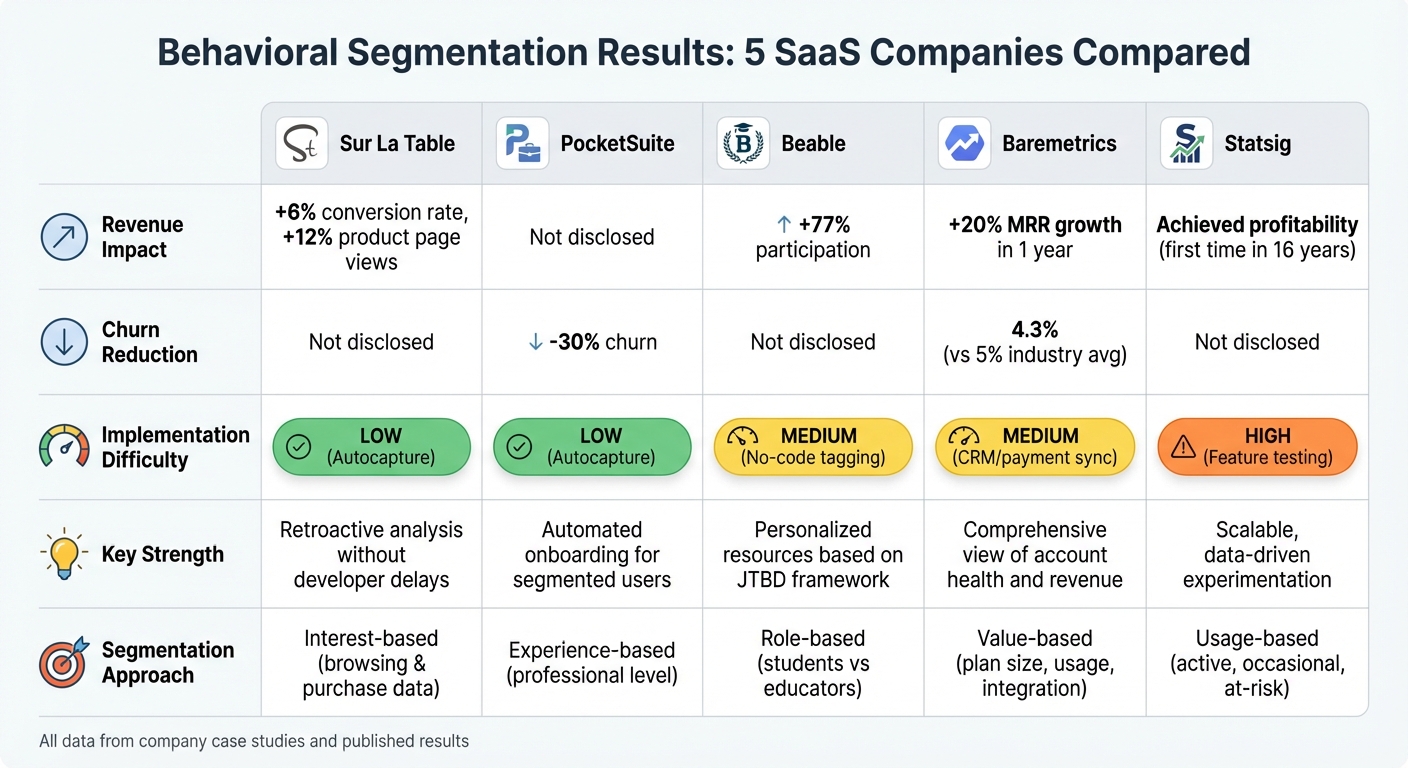
SaaS Behavioral Segmentation: Company Results Comparison
When it comes to behavioral segmentation, each company's strategy highlights a balance between ease of implementation and the potential for revenue growth. Both Sur La Table and PocketSuite took advantage of autocapture technology, which eliminates the need for manual tagging and allows for retroactive behavior analysis. This straightforward method produced impressive results: Sur La Table saw a 12% jump in product page views and a 6% increase in conversion rates, while PocketSuite slashed churn by 30%. The main benefit here is the ability to quickly create user segments without relying on developers.
For a moderately complex approach, Beable demonstrated how focused tagging can drive user engagement. By using no-code tagging to segment users based on the Jobs-to-be-Done (JTBD) framework, Beable achieved a 77% boost in participation by tailoring resource centers to user needs.
On the more complex end of the spectrum, Baremetrics and Statsig showcased how advanced integrations can deliver deeper insights. Baremetrics combined payment and CRM data to monitor revenue metrics across customer segments, achieving a 4.3% churn rate - well below the industry average of 5%. Meanwhile, Statsig’s platform, though technically demanding, enabled feature testing on specific user segments before full rollouts. One company using Statsig hit profitability for the first time in 16 years, and teams were able to reduce A/B test decision times by 7 days.
| Company | Revenue Impact | Churn Reduction | Implementation Difficulty | Key Strength |
|---|---|---|---|---|
| Sur La Table | +6% conversion rate | Not disclosed | Low (Autocapture) | Retroactive analysis without developer delays |
| PocketSuite | Not disclosed | -30% churn | Low (Autocapture) | Automated onboarding for segmented users |
| Beable | +77% participation | Not disclosed | Medium (No-code tagging) | Personalized resources based on JTBD framework |
| Baremetrics | 4.3% avg churn vs. 5% | Below industry avg | Medium (CRM/payment sync) | Comprehensive view of account health and revenue |
| Statsig | Profitability achieved | Not disclosed | High (Feature testing) | Scalable, data-driven experimentation |
These examples show how different levels of implementation complexity can lead to varying but meaningful results.
For companies with fewer technical resources, autocapture tools provide a fast and effective way to segment users and see immediate benefits. On the other hand, businesses with the capacity for more complex integrations can uncover deeper insights into customer lifetime value and predictive behaviors. Whether the focus is on speed or depth, the right approach depends on the company’s goals and technical capabilities.
Conclusion
The message is clear: actions speak louder than assumptions. The most successful companies focus on a specific goal - like reducing churn, boosting activation, or increasing upgrades - and then create user segments based on behaviors that align with that goal.
"If we treat all users the same, our efforts will only hit home with a few." - Abrar Abutouq, Product Manager, Userpilot
For instance, monitoring when users hit usage limits or skip onboarding steps opens up timely opportunities to take action.
"Understanding customers' behavior patterns by focusing on their actions provides crucial insights that will help businesses improve the purchasing process." - Darshil Gandhi, Director of Product Marketing, Amplitude
Getting started doesn’t have to be complicated. Begin with the basics: identify key actions that lead to conversions and pinpoint where users drop off. Build dynamic segments that automatically update as users take these actions, and set up automated triggers. For example, if a user enters a "churn risk" segment - like not logging in for seven days - a re-engagement message can be sent immediately.
The case studies make it clear: behavioral segmentation has the power to reshape your growth strategy. And the numbers back this up - 71% of U.S. consumers now expect personalized experiences, and companies that are great at personalization see a 40% revenue boost from these efforts. Whether you're tracking feature adoption, usage patterns, or readiness to upgrade, let actual user behavior - not averages - drive your decisions.
FAQs
What’s the difference between behavioral and demographic segmentation in SaaS?
Behavioral segmentation zeroes in on how customers actively engage with your SaaS product - things like how often they use it, which features they prefer, or their overall interaction patterns. On the other hand, demographic segmentation organizes users based on fixed attributes like company size, industry, job role, or location.
While demographics give you a general snapshot of your audience, behavioral data digs deeper, uncovering what truly motivates users within your product. This kind of insight allows SaaS companies to create tailored experiences and strategies that directly address customer needs, ultimately fueling growth.
What challenges do SaaS companies face when using behavioral segmentation to drive growth?
SaaS companies face a variety of hurdles when trying to use behavioral segmentation to increase revenue. One of the biggest challenges is staying compliant with data privacy laws like GDPR and CCPA while collecting and using customer data responsibly. Striking the right balance between gaining detailed insights and respecting privacy can be a delicate task.
Another significant issue is data quality. Problems like missing events, inconsistent identifiers, or incomplete logs can lead to unreliable customer segments and flawed insights. On top of that, turning raw usage data into meaningful health scores is no easy feat. This makes it tough to pinpoint which accounts are genuinely thriving versus those that seem promising but don’t perform as expected.
Finally, static segmentation models often fail to keep up with how user behavior changes over time. Many companies lack the tools or expertise to adopt dynamic, real-time updates, which are key to maintaining relevant and effective segments. Overcoming these obstacles is essential for using behavioral segmentation to fuel long-term growth.
How can SaaS companies use behavioral segmentation to drive revenue growth?
To kick off behavioral segmentation, start by clarifying your business objective. Are you looking to boost conversions, cut down on churn, or encourage upsells? Once you’ve nailed that down, monitor key user behaviors that reveal value - think daily log-ins, how often features are used, or the rate of trial-to-paid conversions. This data will help you categorize users into groups like power users, occasional users, or inactive prospects.
With your segments in place, craft strategies tailored to each group. For instance, you might promote premium features to power users, share onboarding tips with occasional users, or send re-engagement emails to those who’ve gone inactive. By weaving these personalized experiences into your app or communication channels, you can make a noticeable difference in both retention and revenue.
If you’re part of a fast-growing SaaS company, tools like Lucid Financials can make this process easier. They integrate product usage data with financial metrics, giving you real-time insights into how different segments impact revenue. This allows you to prioritize high-value users while keeping your finances organized and ready for investors.