Startups often fail due to poor resource allocation - 90% of failures are tied to this, according to a 2023 CB Insights study. ROI frameworks help founders make better decisions by focusing on measurable payoffs. For example, startups tracking ROI metrics have 2.5x higher survival rates after three years (2022 HBR study).
Key takeaways from this guide include:
- Core Metrics: ROI = (Net Profit ÷ Cost of Investment) × 100. Use LTV:CAC, IRR, and MOIC for deeper insights.
- Prioritization Frameworks: Use tools like RICE (Reach, Impact, Confidence, Effort) to rank projects and allocate resources effectively.
- Validation Process: Test initiatives over six months to gather data before scaling.
- Real-Time Tracking: Leverage AI tools for instant ROI insights and predictive analytics.
Smart resource allocation, guided by these frameworks, can significantly improve your startup's chances of success.
Making smart investments: A framework for maximizing your ROI in technical decisions | Katerina I.
sbb-itb-17e8ec9
Core ROI Metrics Every Startup Should Track
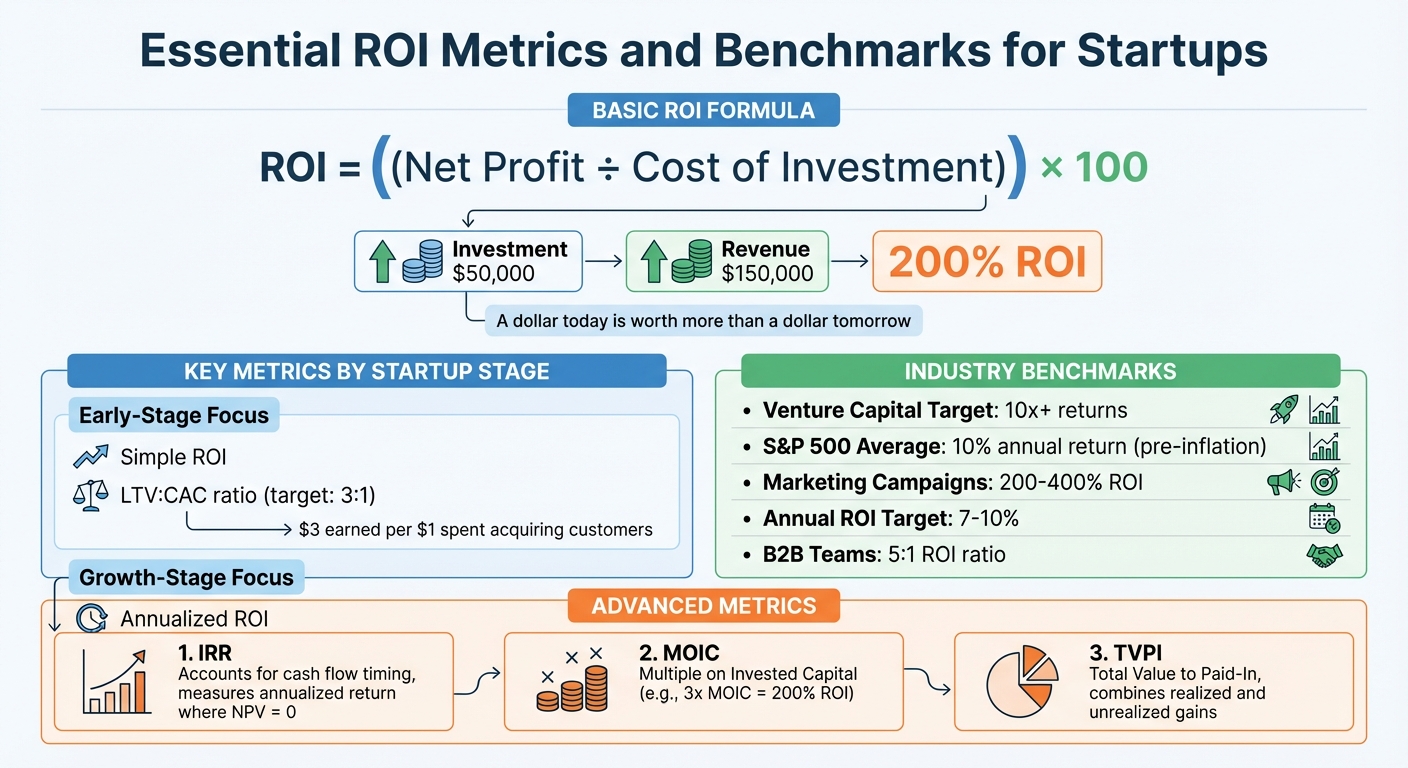
Essential ROI Metrics and Benchmarks for Startups
Understanding ROI is all about knowing which numbers matter and how to apply them effectively. The formula itself is simple, but startups often face added layers of complexity. As SimpleFeasibility aptly notes, "'What's the ROI?' is the first question any investor asks and the last question many entrepreneurs can answer with precision." Below, we’ll explore the key metrics that can help you answer that question confidently.
The Basic ROI Formula
The foundation of ROI calculations is straightforward: (Net Profit ÷ Cost of Investment) × 100. Net profit is simply the revenue generated minus the costs incurred. For instance, if you spend $50,000 on a marketing campaign and it brings in $150,000 in revenue, your ROI would be 200%. However, startups often overlook indirect costs like team hours, software subscriptions, or shared overhead expenses, which can skew results.
When comparing projects with different timeframes, Annualized ROI becomes crucial. It normalizes returns, making it easier to compare a six-month marketing push with a two-year development initiative. The formula for annualized ROI is [(Ending Value ÷ Beginning Value) ^ (1/n)] - 1, where "n" is the number of years. Another useful measure is Incremental ROI, which evaluates whether increasing your budget - like doubling your ad spend - still delivers profitable returns or if you've hit a point of diminishing returns.
For SaaS startups, the LTV:CAC ratio (Lifetime Value to Customer Acquisition Cost) is a game-changer. A ratio of 3:1 is generally considered healthy, meaning you’re earning $3 in customer lifetime value for every $1 spent acquiring them.
A practical tip here: include all costs, even early losses, to get a clearer picture of true returns over time. Also, set a hurdle rate - the minimum acceptable return that factors in your cost of capital and a risk premium. This ensures you’re only pursuing projects that genuinely add value.
IRR, MOIC, and TVPI Explained
Advanced metrics go beyond the basics, offering deeper insights into cash flow timing and overall performance. Internal Rate of Return (IRR) measures the annualized return where your Net Present Value (NPV) equals zero. Unlike basic ROI, IRR accounts for when cash flows occur, making it ideal for evaluating complex investments.
Multiple on Invested Capital (MOIC), on the other hand, shows how many times your initial investment has been returned. For example, a 3x MOIC means a 200% ROI. Meanwhile, Total Value to Paid-In (TVPI) is a metric often used in venture capital. It combines realized and unrealized gains to show the total return relative to the capital invested.
Each of these metrics has its trade-offs. While simple ROI ignores the time value of money, IRR can be misleading if cash flows are erratic. The key is to understand what each metric reveals - and what it doesn’t.
Choosing the Right Metric for Your Stage
The metrics you focus on should align with your startup’s current phase. Early-stage companies benefit most from simple ROI and LTV:CAC, as these provide quick insights into the efficiency of marketing and sales efforts. They’re also invaluable for validating your business model without getting bogged down in complex calculations.
As your startup grows, annualized ROI and IRR become more relevant. These metrics help you assess long-term investments, such as product development or expanding into new markets.
For perspective, venture capitalists often aim for returns of 10x or higher to justify the risks of investing in startups. By contrast, the long-term average annual return of the S&P 500 is roughly 10% before inflation, serving as a benchmark for business investments. Marketing campaigns typically aim for ROI levels between 200% and 400% to cover overhead costs. Remember, a dollar today is worth more than a dollar tomorrow - failing to account for future cash flow discounts can lead to overly optimistic projections.
Frameworks for Prioritizing Startup Investments
Once you’ve identified the ROI metrics you need to track, the next challenge is figuring out where to allocate your limited resources. Startups constantly balance competing demands - features, marketing, infrastructure, and hiring - all of which come with steep opportunity costs. Instead of relying on gut instinct, these frameworks use data to guide smarter investment decisions, laying the groundwork for a systematic, test-and-learn approach.
The RICE Framework for Project Prioritization
The RICE framework builds on ROI metrics by assigning a score to each project, helping you prioritize investments more effectively. RICE stands for Reach, Impact, Confidence, and Effort - four dimensions that quantify a project's potential. The formula is simple: (Reach × Impact × Confidence) ÷ Effort. Higher scores point to projects with better ROI potential.
- Reach measures how many people or how much revenue a project will affect over a given period (typically 12–48 months). For example, a SaaS company might track new feature adoption using quarterly customer counts or annual recurring revenue (ARR).
- Impact gauges the level of change each unit of reach will generate. It uses a standardized scale: 3 for massive change, 2 for high, 1 for medium, 0.5 for low, and 0.25 for minimal.
-
Confidence reflects how reliable your data is. Projects with strong data backing get 100%, those with some precedent score 80%, and speculative ideas land at 50%. As Maxim Atanassov, Founder of Future Ventures, explains:
"A low-confidence 'transformational' project is a story, not a strategy. And RICE makes that visible."
- Effort accounts for the resources required, including financial costs, person-months, and opportunity costs.
Here’s how it works in practice: TitanApps applied RICE to evaluate marketing strategies for their Smart Checklist product in 2025. While "influencer marketing" was a trendy internal favorite, it scored just 2. On the other hand, "updating website copy/messaging" scored 7, so they prioritized the website overhaul instead of chasing the influencer campaign.
To ensure consistency, consider creating a written RICE Constitution. This document can standardize how scores are assigned, requiring RICE scorecards for budget requests above a certain threshold. Calibration workshops can also help align teams on what qualifies as a "Level 3" or "Level 2" impact. This approach shifts decision-making from "I think" to "Here is the evidence."
Scenario Analysis and Sensitivity Testing
Even with RICE, assumptions play a big role in scoring, so validating those assumptions is critical. Scenario analysis helps test how your ROI projections hold up under different conditions. For instance, during a product launch, you might model scenarios where customer acquisition costs increase by 20% or conversion rates drop by 15%. Many startups use 13-week rolling forecasts to monitor cash flow and burn rates, allowing them to adjust as new data becomes available.
Sensitivity testing takes this a step further by isolating individual variables. If your ROI depends heavily on a specific pricing model or sales cycle length, you can test how changing those inputs by 10%, 25%, or 50% affects outcomes. This process highlights which assumptions are "load-bearing" - the ones that could derail the entire project if they’re wrong.
Pair these methods with strategic bucketing to categorize investments into "Growth", "Resilience", and "Innovation." This ensures that essential infrastructure isn’t neglected in favor of short-term revenue opportunities. As the saying goes, "starve zombies and feed stallions" - eliminate low-impact, high-effort projects and focus resources on initiatives with the highest ROI potential. These tools, combined with ROI metrics, provide a structured way to allocate resources with precision.
The 6-Month ROI Validation Process
To ensure your investments are grounded in evidence, a 6-month validation process is an effective way to test assumptions before committing to large-scale initiatives. Jumping into major investments without this step could drain resources unnecessarily. This approach allows you to collect actionable data, refine your strategies, and move forward only with initiatives that have proven their value. The goal is simple: turn your initial hypotheses into concrete evidence before making larger commitments.
How to Structure the 6-Month Test
Start by defining clear success metrics that align with your ROI framework. Break the timeline into evaluation checkpoints at months 3 and 6. This lets you identify early issues and make adjustments before the test concludes. For instance, if you're piloting a new sales channel, set measurable targets like customer acquisition cost (CAC), conversion rates, and revenue per customer.
Use quarterly tracking cycles to stay on top of progress. At the 3-month mark, review your data to catch any red flags and recalibrate if needed. By the 6-month point, you should have enough information to calculate an annualized ROI, which allows for fair comparisons against long-term benchmarks. For example, if your 6-month pilot yielded $50,000 in net profit from a $20,000 investment, your annualized ROI would be around 250%.
Make sure to factor in all costs - both direct and indirect - to avoid overestimating ROI. Direct costs might include advertising spend or software fees, while indirect costs could cover team hours or missed opportunities. To give a clear picture of how resources were allocated, segment your operating expenses (Opex) into categories like R&D, General & Administrative (G&A), and Sales & Marketing (S&M).
Once the pilot concludes, focus on presenting these results clearly and effectively to investors.
Reporting ROI Results to Investors and Boards
After collecting data from your pilot, it’s critical to communicate the findings transparently. Share your 6-month results with comparisons to previous reporting periods to highlight trends rather than isolated snapshots. A helpful way to structure your update is the "Good, Bad, and Ugly" framework:
- Showcase wins with specific numbers.
- Be upfront about setbacks and explain how you’re addressing them.
- Share serious challenges early so investors have time to assist.
As Alan Jones, Partner at M8 Ventures, wisely notes:
"Bad news received early is better than bad news received with too little notice to try to help."
If the pilot didn’t meet its goals, provide a clear explanation for the shortfall and detail the adjustments you’re making. To keep things concise and easy to digest, use a one-page report. Narrative summaries are generally easier for investors to skim and reference than lengthy video updates. Always include a forecast for the next phase, setting clear expectations for scaling efforts. Wrap up with a specific "ask" - whether it’s introductions, strategic guidance, or other forms of support. Visual trendlines can also help illustrate momentum effectively.
As Jones emphasizes:
"A regular schedule of imperfect reports is better than an irregular schedule of perfect reports because regular reports build trust with investors who you need to back you in the next round."
This structured approach not only validates your initiatives but also builds confidence among stakeholders, ensuring every decision is based on solid evidence.
Using Technology to Track ROI in Real Time
Relying on end-of-month reports to gauge your ROI is like trying to steer a ship blindfolded. With modern technology, you can monitor financial performance as it unfolds. This real-time tracking enables you to identify issues early, make swift adjustments, and demonstrate value to investors without scrambling through outdated reports. It also sets the stage for integrating AI to unlock deeper, actionable financial insights.
AI-Powered ROI Analytics
Real-time monitoring is just the beginning. AI-powered tools take it further by automating complex analysis and providing forecasts. Gone are the days of manually cleaning spreadsheets or writing complex queries. With natural language interfaces, you can ask straightforward questions like, "What’s the ROI on our Q1 marketing spend?" and receive instant, data-driven answers. This approach can cut query times by 70%.
The numbers speak for themselves. AI-powered analytics deliver a return of $3.50 for every $1 invested, while real-time dashboards can reduce decision-making delays by over 50%. On top of that, these tools significantly lower human errors - by as much as 90%. Vivek Singh, Executive Vice President at PALNAR, captures the importance of these advancements:
"AI tools are now vital to the scalability and growth potential of most organizations".
Predictive analytics, another key feature, leverages historical data, market trends, and customer behavior to forecast future ROI. This means you’re not just reacting to past results but actively shaping your investment strategies based on anticipated trends. These insights empower you to make proactive decisions that align with both immediate and long-term goals.
For example, tools like Querio AI, starting at $39 per month, offer natural language queries and dynamic dashboards. When considering such tools, it’s essential to evaluate their true cost using a 3-factor ROI framework: factor in the subscription price, setup time, and training requirements to determine the break-even point. Adopting these technologies ensures your decisions remain ROI-focused, blending real-time analytics with forward-thinking strategies.
Aligning Your Team Around ROI Goals
If your team isn’t thinking in ROI terms, even the most advanced analytics won’t deliver results. Shifting from founder-driven decisions to a company-wide focus on ROI requires embedding clear, actionable guidelines into everyday operations. Building on the core principles of an ROI framework, the next step is aligning your team. Here’s how to integrate ROI metrics into daily decision-making and empower everyone to contribute to measurable value.
Setting Clear ROI Metrics and Targets
ROI targets should align with your startup's growth stage. For seed-stage startups, focus on metrics like customer acquisition cost (CAC) and lifetime value (LTV) to validate your market. Growth-stage companies, on the other hand, should zero in on scalability measures such as the burn multiple. For example, Series A SaaS startups typically aim for a burn multiple of 1.6x - spending $1.60 for every $1 of new annual recurring revenue (ARR). As a general benchmark, aim for an annual ROI between 7% and 10%, while B2B teams should strive for a 5:1 ROI ratio.
Document these metrics in your operating principles so they’re crystal clear. This ensures that every team member can make decisions aligned with your company’s vision. As Claire Hughes Johnson, COO at Stripe, explains:
"Your principles should be clear and explicit enough that the people who consult them will make the same decisions a founder of your company would".
When your metrics and targets are well-defined, they eliminate confusion and create consistency across teams. Once these are in place, the next step is weaving them into your daily workflows to guide decision-making.
Making ROI Part of Daily Operations
To integrate ROI thinking into everyday operations, use the RACI model (Responsible, Accountable, Consulted, Informed) for project management. Assign a single "Accountable" person for each project to track and deliver ROI outcomes. This simplifies decision-making and establishes clear ownership.
Another key strategy is distinguishing between Type 1 (irreversible) and Type 2 (reversible) decisions. For example, decisions like testing a new marketing channel or tweaking pricing tiers fall under Type 2. These should be made quickly, without long approval chains. A/B testing can be a valuable tool here, helping resolve debates with hard data. Additionally, set deadlines for decisions at the start of any process. As Dave Girouard, CEO of Upstart, emphasizes:
"WHEN a decision is made is much more important than WHAT decision is made".
This approach keeps the organization moving quickly while keeping ROI front and center in every choice.
How Lucid Financials Supports ROI-Driven Decision-Making

Tracking ROI isn’t just about spreadsheets and quarterly updates anymore. Lucid Financials was designed to provide startups with real-time financial visibility, automated reporting, and expert support - all without the hefty price tag of traditional accounting firms. It’s a great example of how technology can simplify and enhance ROI management on multiple levels.
Real-Time Financial Insights with AI
Lucid uses AI-driven analytics to provide real-time insights and predictive alerts, cutting out those frustrating month-end delays. The platform calculates advanced venture metrics like IRR, MOIC, TVPI, and DPI, offering a clear picture of timing and scalability. And it’s super convenient - integrating directly with Slack so you can ask questions like, “What’s our current runway?” and get quick, accurate answers. Need more help? Expert guidance is just a message away. Automated alerts and forecasts also help flag potential issues early, giving you the chance to act before problems grow.
Streamlined Tax and Bookkeeping
Clean, accurate books are non-negotiable for tracking ROI. Lucid ensures your books are up-to-date within seven days, thanks to AI-powered transaction matching and reconciliation. It also handles federal and state tax filings, optimizes R&D tax credits, and resolves tricky founder-related tax issues like equity grants and multi-entity structures. This level of automation means your team can focus on growth instead of crunching numbers. Plus, monthly closes and financial reports keep your data accurate and ready when you need it.
Investor-Ready Reports and CFO Support
Preparing for investors or board meetings? Lucid makes it easy with one-click, investor-grade reports. You also get access to detailed forecasts, cash flow projections, and what-if scenario modeling to guide smarter decisions. Need strategic advice? CFO-level guidance is available right in Slack, helping you with everything from hiring plans to runway management and capital allocation. Whether you’re raising your first round or preparing for a Series C, Lucid ensures you’re always ready for due diligence and big decisions.
Conclusion
ROI frameworks are more than just financial tools - they're what keep startups afloat. Sahil Agrawal from Qubit Capital puts it perfectly: "ROI measurement is survival math for startups. Cash flow can swing month to month, and funding timelines can stretch far longer than planned". With the median gap between Seed and Series A now at 774 days (about 2.1 years) as of Q4 2024, relying on gut instincts just isn’t an option anymore.
The strategies in this guide - ranging from basic ROI calculations to RICE prioritization and scenario modeling - act as a shared compass for your team. When everyone understands the key metrics, decisions can align with your overall vision, even as your company grows. Stripe’s COO, Claire Hughes Johnson, drives this point home: "Your principles should be clear and explicit enough that the people who consult them will make the same decisions a founder of your company would".
The proof? Look at Nubank. In 2024, this digital bank expanded its user base from 93.9 million to 114.3 million while keeping operating costs at just $0.80 per customer. This is what data-driven decision-making achieves - far more reliable than relying on "vibes."
The real challenge is knowing when to act fast and when to apply careful analysis. Dave Girouard, Founder and CEO of Upstart, sums it up well: "We're deeply driven by the belief that fast decisions are far better than slow ones and radically better than no decisions". With the right frameworks, a solid tech stack, and clear team alignment, you can allocate resources wisely, sidestep major errors, and focus on sustainable growth - not just getting to the next funding milestone.
FAQs
How do I choose the right ROI metric for my startup stage?
Choosing the right ROI metric depends on where your startup stands and what you're aiming to achieve. If you're in the early stages, focus on growth and attracting customers with metrics like Customer Acquisition Cost (CAC) and Lifetime Value (LTV). As your business grows and stabilizes, shift your attention to profitability indicators like gross margin and net profit ROI. Pick metrics that match your current goals to get meaningful insights and make better decisions.
What costs should I include so my ROI isn’t misleading?
To get an accurate picture of your ROI, make sure you factor in all costs related to your core operations. This means accounting for direct expenses, overhead, marketing costs, and any other spending that impacts your cash flow. Ignoring these can result in calculations that don’t reflect the true performance of your investments.
How do I set a hurdle rate for ROI decisions?
To determine a hurdle rate for ROI decisions, start by identifying the minimum return an investment needs to be worthwhile. This involves factoring in elements like risk, opportunity cost, and your company’s required rate of return. Typically, this rate is tied to your cost of capital, though it may be adjusted for risks specific to the project. Once set, the hurdle rate acts as a benchmark to decide if potential investments clear this threshold and are worth pursuing.