Non-financial metrics give you insights into what drives your company’s performance beyond just revenue and profit. These metrics focus on areas like customer satisfaction, employee engagement, and product quality - helping you predict trends and take action before financial issues arise. For example, a drop in Net Promoter Score (NPS) often signals potential revenue loss, while high employee engagement boosts productivity and sales.
Key Takeaways:
- Why They Matter: Financial metrics show past performance, but non-financial metrics explain why and help forecast the future.
- For Startups: Metrics like customer retention and product adoption reveal growth opportunities and help refine strategies.
- Examples: NPS, retention rate, market share, and product defect rate are essential to track.
- How to Use Them: Focus on 3-5 metrics relevant to your goals, track them consistently, and connect them to financial results.
By integrating these metrics into your board reports, you’ll provide a clearer picture of what’s driving your company’s success and where to focus next.
Are Non-Financial Indicators More Important than Pure Financial Performance?
sbb-itb-17e8ec9
Core Non-Financial Metrics for Board Reports
Non-financial metrics can transform board reports from simple historical overviews into tools for strategic insight. These operational indicators complement financial data, providing a broader perspective for decision-making. The key metrics fall into three main categories: customer, market, and product development. Together, they paint a detailed picture of your startup's progress.
Customer Metrics
Customer metrics help forecast revenue trends before they show up in financial statements. For instance, the Net Promoter Score (NPS) measures customer loyalty and satisfaction. It’s calculated by subtracting the percentage of detractors (scores 0–6) from promoters (scores 9–10). This score helps boards evaluate customer satisfaction strategies and competitive positioning.
Another crucial metric is the Customer Retention Rate, which reflects the percentage of customers who continue using your service over time. High retention rates signal strong product-market fit and stable future cash flows. This is especially important since acquiring new customers can cost 5–25 times more than retaining existing ones . Pairing retention rates with Customer Lifetime Value (CLV) provides deeper insights to guide spending decisions.
Market Position Metrics
Market position metrics build on customer insights, showing how your company stacks up against competitors and whether strategic investments are yielding results. Market Share is a key indicator here, as it directly impacts bargaining power, pricing flexibility, and economies of scale. Even during economic downturns, strong market metrics demonstrate resilience. As ClearPoint Strategy explains:
"If you're getting high marks for company culture and customer satisfaction during a trade war, you're being successful in key parts of your strategy, and that should pay off in the long term".
Another critical measure is the CAC Payback Period, which tracks how long it takes to recover customer acquisition costs through revenue. For B2B SaaS companies, a target of under 18 months is often ideal. This metric helps boards evaluate whether your growth strategy is scalable without excessive cash burn.
Product Development Metrics
Product metrics assess whether your innovation efforts are translating into measurable success. The Digital Adoption Rate tracks how effectively users are implementing your tools and features. High adoption rates often lead to efficiency gains of 20–30%. Similarly, the Innovation Rate, which measures the percentage of revenue from new products, reflects the strength of your R&D efforts. Boards should also monitor the Product Defect Rate, as quality issues can be an early warning sign of customer churn.
To make the most of these metrics, track them consistently and compare them to industry benchmarks. Start with three to five metrics that align closely with your immediate business goals, and expand your focus as your reporting evolves.
Selecting and Aligning Non-Financial Metrics with Financial Data
Financial vs Non-Financial Metrics Comparison for Board Reports
How to Choose the Right Metrics
To make an impact, choose metrics that align with your goals, inspire action, are easy to measure, and matter to your key stakeholders. Start by identifying your current priorities - whether that's expanding your user base, cutting churn, or driving profitability. Then, select metrics that directly measure progress toward these objectives.
For example, linking Customer Acquisition Cost (CAC) to Lifetime Value (LTV) often requires tracking metrics like retention rate or Net Promoter Score (NPS). Many top SaaS companies aim for a CAC payback period of under 18 months. They use retention data to forecast LTV, helping them predict long-term profitability. It’s smart to start small - focus on 3-5 key metrics to get comfortable with the process before broadening your scope. This approach makes it easier to connect operational performance to financial outcomes.
Connecting Metrics for Better Insights
Non-financial metrics are often leading indicators that reveal the story behind financial results before they appear on your profit and loss statement. For instance, if customer satisfaction drops from 8.5 to 6.2, it could explain a 15% revenue decline and signal potential churn. This is why CFOs increasingly integrate these indicators into revenue forecasts, cost planning, and workforce projections.
Tools like Lucid Financials take this a step further by automating the integration of non-financial data - like Slack engagement metrics - with financial records. This creates real-time, investor-ready reports, enabling quicker, informed decisions. For example, if engagement metrics dip, budgets can be adjusted immediately. It’s like having CFO-level insights without the extra workload.
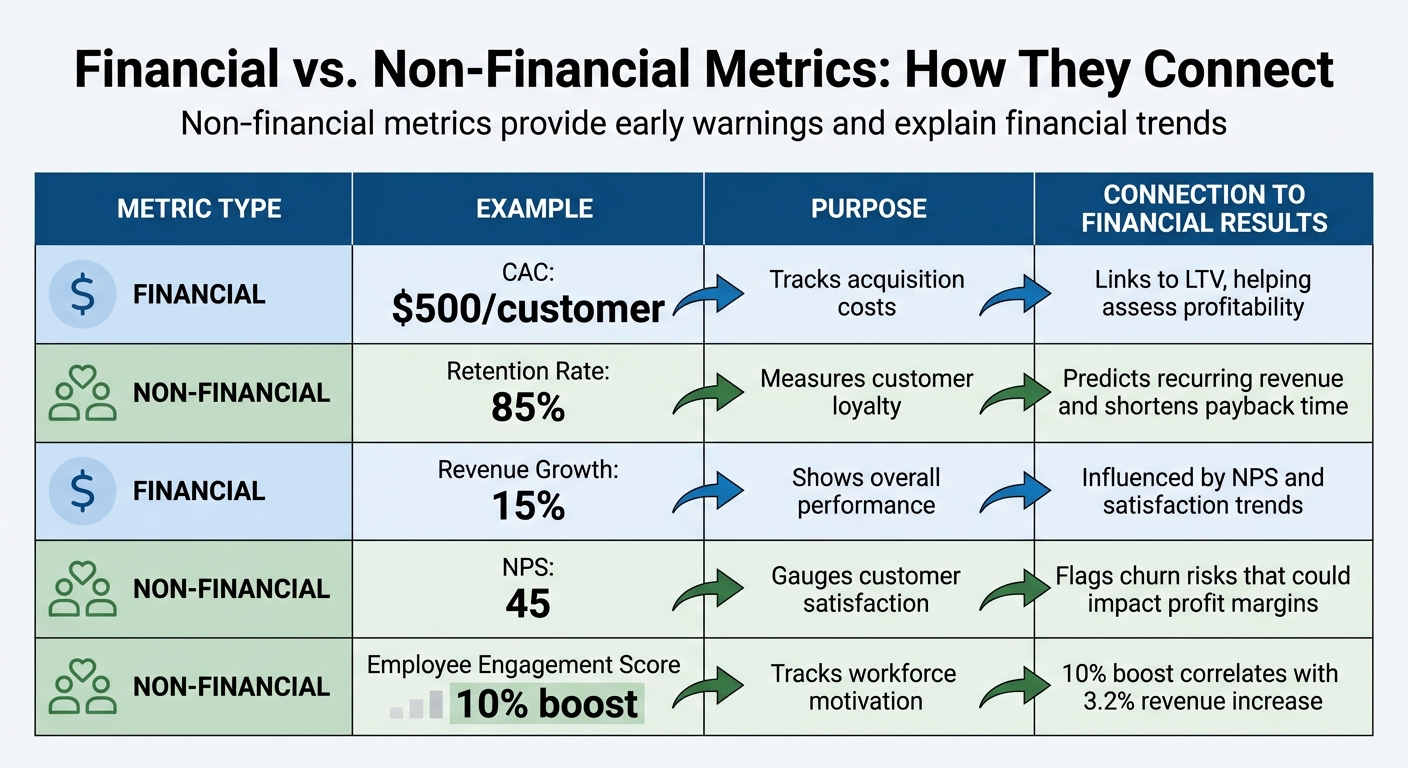
Example: Financial vs. Non-Financial Metrics Comparison
| Metric Type | Example | Purpose | Connection to Financial Results |
|---|---|---|---|
| Financial | CAC ($500/customer) | Tracks acquisition costs | Links to LTV, helping assess profitability |
| Non-Financial | Retention Rate (85%) | Measures customer loyalty | Predicts recurring revenue and shortens payback time |
| Financial | Revenue Growth (15%) | Shows overall performance | Influenced by NPS and satisfaction trends |
| Non-Financial | NPS (45) | Gauges customer satisfaction | Flags churn risks that could impact profit margins |
| Non-Financial | Employee Engagement Score | Tracks workforce motivation | A 10% boost correlates with a 3.2% revenue increase |
This table highlights how non-financial metrics provide early warnings and help explain financial trends. They guide companies in taking proactive steps to improve performance and profitability.
Steps to Add Non-Financial Metrics to Board Presentations
Once you've selected and aligned your metrics, the next step is integrating non-financial data into your board presentations effectively. Here’s how you can do that.
Identify and Benchmark Key Metrics
Start by pinpointing the key performance indicators (KPIs) that matter most for your organization. Organize these metrics into five categories: Products & Services, Operations & Safety, Talent & Culture, Market & Reputation, and Resilience & Sustainability. This approach follows global integrated reporting standards, ensuring you address the main drivers of organizational value.
The focus should always be on metrics that reflect your organization's overall health. As the NACD Staff puts it:
"Financial metrics essentially count the money made from activities, while nonfinancial metrics are about the activities themselves".
For each KPI, define it clearly, identify its data source, and establish guidelines for interpretation tailored to board-level discussions. For example, compare your employee retention rates with industry benchmarks to uncover areas needing attention. Once you've gathered this data, visualizing these benchmarks will help you uncover meaningful trends.
Visualize Trends and Add Context
Dashboards are your best friend when presenting trends. Instead of showing isolated data points, focus on how metrics evolve over time. For instance, a steady decline in customer satisfaction over several months reveals much more than a single snapshot. Highlight these trends and explain any significant changes, connecting them to potential financial outcomes whenever possible.
Adding context is crucial. Show how improvements in areas like employee engagement can lead to measurable financial benefits. This helps board members see the strategic value behind operational changes.
Use AI Tools for Faster Reporting
With clear trends and contextual insights in hand, you can speed up your reporting process by leveraging AI tools. Platforms like Lucid Financials simplify data aggregation by combining financial and non-financial metrics into polished, investor-ready reports. Lucid Financials connects directly to your systems - such as Slack engagement data - allowing you to generate comprehensive presentations in just a few hours instead of days.
The platform doesn’t stop at aggregation. Its AI capabilities can forecast trends and send alerts based on real-time data. For example, if engagement metrics drop or retention rates shift, the system flags these changes, enabling you to assess their potential financial impact immediately. This transforms board reporting from a backward-looking exercise into a forward-thinking tool for strategic planning.
Best Practices for Reporting Non-Financial Metrics
Once you've integrated non-financial data into your board reports, these best practices can help you fine-tune your approach.
Focus on Trends and Context
Highlight trends instead of isolated numbers. Board members need to understand how metrics change over time. For instance, a line graph showing the Net Promoter Score (NPS) climbing from 6.2 to 8.5 over six months paints a much clearer picture than a single data point ever could . Always pair trends with context. If there's a sudden NPS drop, for example, it might be tied to an increase in support tickets .
Similarly, when employee engagement drops by 10%, explain the potential ripple effects - like increased turnover costs within three to six months. Research shows that engaged teams see 18% higher sales productivity and 23% greater profitability. By analyzing trends and their underlying causes, you provide deeper insights that complement earlier efforts to link non-financial and financial data.
Maintain Consistency in Metrics
Stick to the same KPIs every time. Changing metrics between board meetings can disrupt progress tracking and reduce trust. Define each metric clearly and use the same calculation methods consistently. For example, always calculate NPS as promoters minus detractors on a 0–10 scale . Report these metrics quarterly, using the same definitions and methodologies.
This approach is especially critical for metrics like employee engagement or operational cycle times. For engagement, use identical survey questions each quarter to measure satisfaction and trust, and present results as percentages. For example, a 10% boost in engagement has been linked to a 3.2% increase in revenue. Similarly, standardizing how you measure cycle times ensures that each board meeting builds on the last, allowing you to track real progress rather than noise.
Use Lucid Financials for Faster Results

To build on consistency and context, consider leveraging AI-powered tools for smoother reporting. Lucid Financials can deliver clean, organized reports within seven days while seamlessly integrating non-financial metrics with financial data. The platform syncs with tools like Slack, giving you real-time insights into customer retention, NPS, on-time delivery rates, revenue, and cash flow.
Lucid Financials automates trend analysis and flags key changes - such as a drop in NPS or shifts in retention rates - so you can quickly assess their potential financial impact. By ensuring metrics are accurate and consistent across all board meetings, the platform allows you to spend less time on data preparation and more on making strategic decisions.
Conclusion
Non-financial metrics can turn board presentations into forward-looking, strategic tools. By blending customer satisfaction scores, employee engagement data, and operational efficiency metrics with revenue and cash flow figures, you equip your board with a more complete view - not just of past performance, but also of potential future outcomes. For example, a dip in financial performance paired with declining customer satisfaction often points to deeper issues that financial data alone might overlook.
Taking this a step further, connecting these metrics to AI financial planning enhances strategic planning. If employee engagement drops below a specific threshold, you can anticipate rising turnover costs and adjust hiring budgets accordingly. Similarly, slipping on-time delivery rates - say, below 95% - could signal upcoming customer churn or contract penalties, allowing you to act before these issues hit your financials. These insights help steer board discussions toward proactive decision-making rather than reactive problem-solving.
To get started, focus on three to five key metrics that align with your business goals, such as customer retention, Net Promoter Score, or operational cycle times. Reporting these consistently each quarter builds trust and highlights trends over time.
Lucid Financials makes this process seamless by automatically integrating non-financial metrics with financial data. The platform generates clear, actionable reports within seven days and offers real-time updates through Slack. This means you can track customer retention alongside revenue, link NPS to cash flow, and identify problems before they affect your bottom line.
FAQs
Which non-financial metrics should we report to the board first?
To make sound long-term decisions, it's essential to focus on key strategic metrics that align with your business goals. Start with metrics like cash runway, revenue, and operational KPIs, as they paint a clear picture of your financial health and operational efficiency. Add in growth metrics, such as MRR (Monthly Recurring Revenue) or ARR (Annual Recurring Revenue), to track progress over time. Finally, include risk assessments to understand potential challenges. Together, these metrics provide a solid foundation for evaluating performance and making well-informed choices.
How do we tie non-financial metrics to revenue and cash flow?
Startups can connect non-financial metrics to revenue and cash flow by leveraging real-time data on essential indicators such as monthly recurring revenue (MRR), annual recurring revenue (ARR), customer acquisition costs, and operational KPIs. By doing this, they gain a clearer view of how these metrics influence financial outcomes. This approach helps businesses make quicker, well-informed decisions and stay ahead in their strategic planning.
How often should these metrics be updated for board meetings?
Key financial and operational metrics should be updated frequently. In many cases, daily or near-real-time updates are ideal. This approach ensures the board always has access to the most accurate and up-to-date information, enabling better and more informed decision-making.