Multi-scenario analysis helps startups navigate uncertainty by planning for various possible outcomes. Instead of relying on a single forecast, this approach evaluates how different scenarios - such as funding gaps, market changes, or unexpected growth - affect your business. Key techniques include:
- Monte Carlo Simulations: Run thousands of scenarios to estimate probabilities of outcomes. Example: A SaaS startup predicts a 70% chance of an 18-month runway.
- Sensitivity Analysis: Pinpoint which variables (e.g., pricing or churn) have the biggest impact on results. Example: Dropbox reduced churn by 15%, boosting lifetime value by 28%.
- Stress Testing: Simulate extreme conditions (e.g., 50% revenue drop) to prepare for worst-case scenarios. Example: A fintech startup pivoted to bootstrapping after stress-testing for funding delays.
These methods identify risks, guide resource allocation, and improve decision-making. Tools like AI-powered platforms simplify scenario modeling, saving time and enabling faster insights. Start with clean data, build dynamic models, and validate results regularly to make informed financial decisions.
Scenario & Sensitivity Modeling in Excel | FMVA® Course Preview
sbb-itb-17e8ec9
Core Techniques for Multi-Scenario Analysis
When creating financial models for your startup, there are three standout methods to tackle uncertainty: Monte Carlo simulations, sensitivity analysis, and stress testing. Each of these approaches examines risk from a unique angle, helping you gauge potential effects on cash flow, runway, and growth plans.
Monte Carlo Simulations
Monte Carlo simulations involve running thousands of scenarios by sampling from predefined probability distributions. Essentially, they answer the question: What are the chances of different outcomes? For instance, a SaaS startup might model monthly recurring revenue using a normal distribution (e.g., a 20% average growth rate with a 10% standard deviation), customer acquisition costs ranging from $200 to $500, and churn rates between 5% and 15%. Running 10,000 iterations could reveal, for example, a 70% probability of an 18-month runway.
In Q1 2023, Brex used Monte Carlo simulations to evaluate 5,000 scenarios for its fintech clients. The analysis showed that optimizing burn rates could extend runway from 9 to 18 months, ultimately helping 200 portfolio companies raise $50 million in additional funding.
To implement Monte Carlo simulations, you can use tools like Excel with add-ons such as @RISK, Python libraries like NumPy and SciPy, or platforms like Palisade DecisionTools. The key is to base your probability distributions on realistic historical data. Even if you only have three months of sales data, you can define a triangular distribution (e.g., 30 days minimum, 45 days most likely, and 90 days maximum) to start building your model.
Once you’ve run your simulations, the next step is to identify which variables matter most through sensitivity analysis.
Sensitivity Analysis
Sensitivity analysis helps you zero in on the variables that have the greatest impact on your results. By tweaking one variable at a time - like customer lifetime value - and holding others constant, you can measure its effect on profitability. For example, a 10% increase in lifetime value might boost profitability by 25%, while a 10% change in marketing spend might only shift it by 5%.
Dropbox used this approach in 2014 under CFO Ajay Agarwal. They discovered that reducing churn by 15% increased lifetime value by 28% (from $120 to $154 per user). This insight led to a marketing reallocation that tripled their growth. For your startup, you could use Google Sheets to build a data table, varying inputs such as pricing (e.g., $49 to $99 per month) and gross margin (e.g., 60% to 80%). By plotting the results, you might find that pricing has the biggest impact, signaling it’s time to run A/B tests before scaling your engineering team.
Stress Testing
Stress testing takes things a step further by evaluating how your model holds up under extreme conditions. This involves simulating worst-case scenarios like a 50% revenue drop, doubled costs, or losing 40% of your customers. While these situations might seem far-fetched, they can have a huge impact. During the 2022 tech downturn, startups that had stress-tested for funding delays and hiring freezes were better prepared.
For example, one fintech startup found that a 60% funding delay could shrink its runway from 18 months to just 4. Acting on this insight, the company pivoted to bootstrapping, which ultimately saved it from bankruptcy. Your stress tests should also account for "black swan" events specific to your industry - like supply chain disruptions increasing costs by 20% or regulatory changes cutting market size by 30%. These scenarios can guide you to prepare safeguards, such as maintaining 6 to 12 months of cash reserves or planning for a 30% headcount reduction.
These techniques - Monte Carlo simulations, sensitivity analysis, and stress testing - give you a solid framework for evaluating and prioritizing potential risks and opportunities. By applying them thoughtfully, you’ll be better equipped to navigate uncertainty and make informed decisions.
How to Weight and Prioritize Scenarios
After building your scenarios, the next step is assigning probability weights to each one, ensuring they total 100%. This process helps refine your strategy by turning a range of possible outcomes into a structured forecast. A common breakdown might look like this: 55% for the Base Case, 30% for the Worst Case, and 15% for the Best Case. These percentages reflect a realistic outlook - where the Base Case is the most probable, while extreme scenarios are less likely.
To assign these weights effectively, rely on both expert insights and market data. Engage your sales, finance, and operations teams to understand what’s happening on the ground. For instance, if your sales team notices rising customer acquisition costs, it might make sense to increase the weight of your Worst Case scenario. Don’t forget to consider external factors like inflation, regulatory changes, or shifts in market trends. With economic conditions becoming more unpredictable, CFOs are increasingly turning to scenario planning to navigate these uncertainties.
Focus on three to five key variables that carry both high uncertainty and significant impact. These could include macroeconomic factors like inflation or operational metrics such as customer churn or cost of goods sold. Each scenario should tell a clear and coherent story, rather than just being a set of random numbers. For example, label your Worst Case scenario something like "The Funding Freeze", which could describe a situation where market funding dries up, forcing you to cut operating expenses drastically. On the other hand, your Best Case could be "Early Enterprise Adoption", highlighting a scenario where rapid market traction drives significant revenue growth.
Once your scenarios are weighted, use them to calculate an Expected Value. This is a probability-weighted average that offers a single decision-making benchmark. The formula is straightforward:
Expected Value = (Outcome_Base × Weight_Base) + (Outcome_Worst × Weight_Worst) + (Outcome_Best × Weight_Best).
For example, if your Base Case projects $500,000 in revenue (55% probability), your Worst Case estimates $200,000 (30%), and your Best Case forecasts $800,000 (15%), the Expected Value would be $455,000. This number can guide critical decisions related to hiring, budgeting, and fundraising. Just make sure your Worst and Best scenarios are distinct enough from the Base Case to avoid falling into anchoring bias.
Using AI for Dynamic Scenario Modeling
AI tools are transforming how startups handle scenario planning by automating tasks that used to require weeks of manual effort. Instead of having a full finance team spend days building models, AI can now generate multiple scenarios in just minutes. It handles hundreds of interconnected variables that would otherwise overwhelm smaller teams. By 2024, 52% of CFOs reported using generative AI for predictive modeling and scenario analysis, highlighting a major shift in financial planning. This shift allows startups to create faster and more accessible financial models.
For example, AI-powered platforms can reduce an 8-day manual process of updating P&L actuals and forecasts into a 4-minute automated task. When it comes to creating and analyzing scenarios, AI slashes the time required by 6 days. This efficiency allows lean startup teams to adopt "continuous planning" - a dynamic, ever-updating model that adjusts automatically to market changes, replacing outdated quarterly forecasting methods.
AI tools also make advanced modeling easier for founders without extensive finance experience. Many platforms now come with natural language interfaces that provide real-time forecasts without requiring complex formulas. For instance, Lucid Financials integrates directly with Slack, enabling founders to ask about runway, spending, or performance and receive instant, AI-generated insights. These insights are backed by human experts, making enterprise-level scenario planning accessible without the need for large teams or expensive infrastructure.
However, human oversight remains essential. While 98% of CEOs expect immediate benefits from AI adoption, experts stress the importance of a governance process. Finance professionals should review and validate AI-generated scenarios before they inform major decisions. This ensures accuracy and allows smaller teams to achieve the capabilities of a much larger department, freeing up time for strategic decision-making instead of data entry.
To get started, consider piloting AI scenario modeling for a specific task, like quarterly revenue forecasting or cash flow stress-testing. Ensure your financial data, CRM metrics, and ERP information are consolidated into a single source of truth - AI models rely on clean, well-organized data. Focus on key variables that impact your business, such as customer acquisition cost or churn rate, and let AI model these areas specifically. This targeted approach allows you to see results quickly without needing to overhaul your entire finance process all at once.
Comparing Multi-Scenario Analysis Techniques
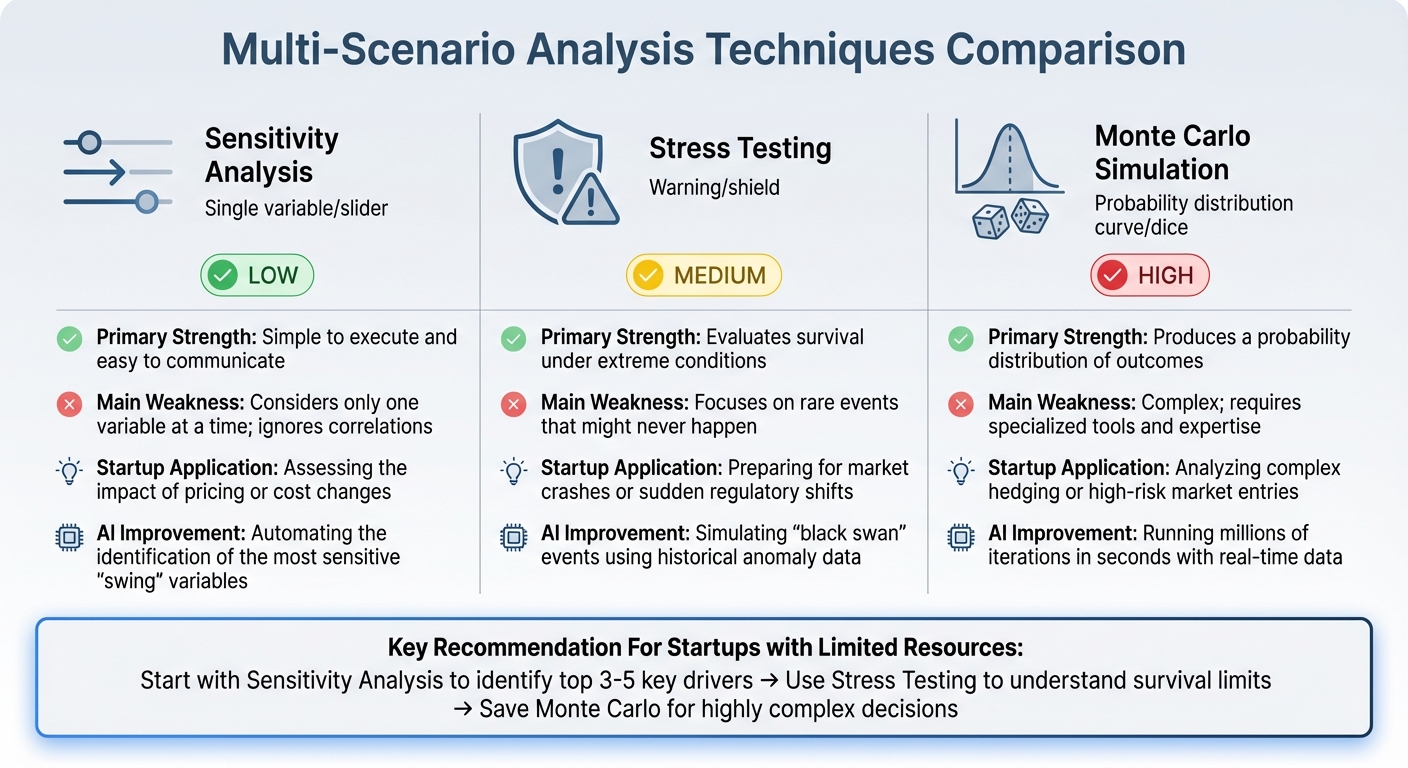
Multi-Scenario Analysis Techniques Comparison for Startups
This section synthesizes key multi-scenario analysis methods to help you choose the right approach for startup financial planning. Each technique offers unique insights, tailored to different aspects of decision-making.
Sensitivity analysis focuses on understanding how a single variable - like a 5% price hike - affects outcomes. It’s straightforward, works well with basic spreadsheets, and is easy to explain to investors. However, it doesn’t consider how multiple variables interact.
Stress testing, on the other hand, examines how your startup might withstand extreme, unlikely events. Think of scenarios like a total market crash, a 100% surge in supply chain costs, or sudden regulatory changes. This method is invaluable for identifying your business’s breaking points.
Monte Carlo simulations take things a step further. By running thousands of iterations with random inputs across multiple variables, they create a probability distribution of potential outcomes. Instead of asking, "What happens if X occurs?", this method estimates how likely different scenarios are. While incredibly useful for complex situations - like evaluating high-risk market entries or hedging strategies - it often requires specialized tools and expertise, which can be a hurdle for early-stage startups.
Technique Comparison Table
| Technique | Primary Strength | Main Weakness | Startup Application | AI Improvement |
|---|---|---|---|---|
| Sensitivity Analysis | Simple to execute and easy to communicate | Considers only one variable at a time; ignores correlations | Assessing the impact of pricing or cost changes | Automating the identification of the most sensitive "swing" variables |
| Stress Testing | Evaluates survival under extreme conditions | Focuses on rare events that might never happen | Preparing for market crashes or sudden regulatory shifts | Simulating "black swan" events using historical anomaly data |
| Monte Carlo Simulation | Produces a probability distribution of outcomes | Complex; requires specialized tools and expertise | Analyzing complex hedging or high-risk market entries | Running millions of iterations in seconds with real-time data |
For startups with limited resources, sensitivity analysis is a great starting point to identify your top 3–5 key drivers. Once you’ve pinpointed these, stress testing can help you understand your survival limits. Save Monte Carlo simulations for highly complex decisions, like entering a new market with multiple uncertainties.
The key takeaway? Match the method to your specific decision and the quality of your available data. The most sophisticated tool isn’t always the best fit - choose what aligns with your needs and resources.
How to Implement Multi-Scenario Analysis
Turning theoretical models into actionable insights for startup planning requires careful execution. Start by gathering your financial data from tools like QuickBooks or Xero. You'll need at least 12–24 months of historical figures, including revenue, expenses, cash flow, and customer acquisition metrics. Make sure to clean and format this data using U.S. conventions - currency as $1,234,567.89, dates as MM/DD/YYYY, and commas for thousand separators. This step ensures your scenarios are grounded in accurate data rather than assumptions. Once your data is ready, move on to building your base financial model.
Construct your base model in Excel or Google Sheets. Set up a three-statement model that includes an income statement, balance sheet, and cash flow. Add clear assumption inputs like monthly burn rate (often $50,000–$200,000 for early-stage startups) and revenue growth rates. To make your model dynamic, incorporate scenario toggles using Excel tools like Data Table or Scenario Manager. These toggles allow you to easily switch between base, optimistic, and pessimistic cases. For example, in Q1 2024, Brex ran 5,000 Monte Carlo simulations to test base, downside, and upside scenarios, factoring in potential funding delays. This analysis helped them extend their runway by 35%, increasing from $18M to $24M. Use similar toggles to define and test your scenarios.
Set up three to five scenarios - base, optimistic, and pessimistic - driven by specific variables. The base case should reflect realistic expectations, such as 30% revenue growth. The optimistic case might assume the best outcome, like 60% growth fueled by viral adoption. The pessimistic case should account for challenges, such as 10% growth during a recession with 15% monthly churn. To refine your analysis, apply sensitivity testing by adjusting one input at a time (e.g., pricing from $49 to $99/month) to see its impact. Alternatively, run Monte Carlo simulations using tools like Excel add-ins (@RISK) or Python to perform 1,000–10,000 iterations with probabilistic distributions.
Once your model is built, validate its accuracy and refine it regularly. Compare your base scenario against historical data - did it align with last quarter's 25% growth? Review the results with advisors or your CFO team, and update the model quarterly as new milestones are achieved, such as hitting $2M ARR or closing a funding round. Tools like Lucid Financials can simplify this process by automating tasks like cleaning up your books in just seven days, collecting data in real-time, and enabling instant scenario modeling through Slack. For example, you can ask, "What happens with a 20% churn rate?" and immediately receive investor-ready reports formatted to U.S. standards.
Conclusion
Multi-scenario analysis changes the game for startup financial planning by modeling best-, worst-, and most-likely outcomes. It helps tackle risks like cash flow mismanagement - one of the leading causes of startup failures, affecting 82% of businesses. With this approach, you can create a clear roadmap to allocate resources wisely, extend your runway, and make informed decisions when the market shifts.
The techniques outlined in this guide work together to provide a detailed view of potential outcomes. By running thousands of iterations, you can identify critical factors - like customer acquisition costs or churn rates - that directly impact your financial health. According to a 2022 McKinsey survey of 800 executives, startups using advanced scenario planning outperform others by 2.5 times during economic downturns. This method strengthens both strategic and operational decision-making, reinforcing the core principles discussed here.
That said, building these models manually is a significant hurdle. It requires time, expertise, and resources that many early-stage teams don’t have. AI-powered tools like Lucid Financials simplify this process. Instead of spending weeks setting up simulations or manually testing variables, you can ask straightforward questions - like "What happens if churn hits 20%?" - directly in Slack and receive polished, investor-ready reports in minutes. Lucid automates data collection, runs thousands of iterations instantly, and ensures your financial models stay current with market changes.
Whether you're preparing for funding, hiring key talent, or navigating market shifts, multi-scenario analysis equips you with the clarity to make timely, confident decisions. By updating your models regularly, focusing on key drivers, and letting AI handle the complex tasks, you can make faster decisions, optimize resources, and maintain a financial plan that grows with your startup.
FAQs
How do I choose between sensitivity analysis, stress testing, and Monte Carlo simulations?
Choosing the right approach depends on your startup's financial goals and the level of analysis required:
- Sensitivity analysis helps you see how small changes in key factors, like revenue or expenses, can influence your outcomes. It's great for quick, targeted insights.
- Stress testing is all about preparing for the worst. It examines how your business would hold up under extreme, adverse conditions.
- Monte Carlo simulations dive deeper, running countless random scenarios to give you a probabilistic view of potential risks and uncertainties.
In short, use sensitivity analysis for fast evaluations, stress testing to brace for tough situations, and Monte Carlo simulations when dealing with complex uncertainties.
What data do I need to run multi-scenario analysis with limited history?
To carry out a multi-scenario analysis when historical data is scarce, start by zeroing in on the most critical factors - think revenue drivers, cost structures, and growth rates. These elements serve as the backbone of your projections.
Refine these inputs by leaning on industry benchmarks, expert opinions, or market research. This approach helps ground your assumptions in reality, even when your own data is limited. Then, build out best-case, worst-case, and base-case scenarios to address potential uncertainties and give a fuller picture of possible outcomes.
If the process feels overwhelming, tools like AI-powered platforms can simplify things. These tools can integrate your assumptions and automate calculations, offering projections that align with the data you have available.
How often should I update scenario weights and forecasts as my startup changes?
Updating your scenario weights and forecasts on a regular basis is key to keeping your financial planning on point. As your startup grows and the business environment changes, assumptions that once made sense might no longer apply.
By revisiting and adjusting these elements, you can ensure your plans stay accurate and aligned with both shifting market conditions and your evolving internal goals. This proactive approach helps you stay prepared and responsive to what’s happening both inside and outside your business.