Profitability simulations help startups predict financial outcomes by testing different scenarios. Instead of relying on a single forecast, startups can adjust factors like pricing, growth rates, and costs to see how they impact profits. This approach reduces risks and improves decision-making, especially for budgeting, hiring, and fundraising.
Key takeaways:
- Simulations matter: They identify risks and key financial drivers (e.g., churn rate, Customer Acquisition Cost).
- Inputs are critical: Revenue, costs, and timing assumptions must be realistic and data-driven.
- Scenario modeling: Compare base (expected), upside (optimistic), and downside (worst-case) scenarios to guide decisions.
- Tools like Lucid Financials streamline this process**, offering automated forecasting, real-time updates, and investor-ready reports for $150/month.
The goal isn’t to find perfect numbers but to explore possibilities, spot risks, and make smarter financial decisions.
Startup Financial Modeling Explained (+ FREE Template)
sbb-itb-17e8ec9
Key Inputs for Building a Profitability Model
When it comes to creating a profitability model, the accuracy of your inputs can make or break the reliability of your projections. A solid model isn’t about predicting the future - it’s about building a structured set of assumptions that reflect reality. As Pitchgrade explains, "A financial model is a structured set of assumptions, not a prediction of the future." To get there, you need to focus on three key areas: revenue, costs, and timing.
Revenue Drivers
A common pitfall in revenue forecasting is relying on overly optimistic top-down estimates, like assuming a 1% share of a $10 billion market. These forecasts often fail under scrutiny and can turn off investors. Instead, bottom-up modeling is more credible. It builds forecasts based on real-world data like sales processes and unit economics.
The key inputs for revenue will vary depending on your business model:
- SaaS companies: Focus on metrics like Account Executives (AEs), quota per AE, Annual Contract Value (ACV), sales cycle length, and churn rate.
- Marketplaces: Track supply-and-demand metrics, conversion rates, and take rate.
- Consumer subscription businesses: Prioritize top-of-funnel traffic, conversion rates to paid tiers, and expansion revenue.
Don’t overlook the importance of Net Revenue Retention (NRR). This metric tells you how your revenue from existing customers changes after factoring in churn, downgrades, and upsells. A strong NRR above 100% means your existing customers are driving revenue growth even before you bring in new ones.
Cost Drivers
On the expense side, it’s essential to separate Cost of Goods Sold (COGS) from Operating Expenses (OPEX). COGS includes the direct costs to deliver your product or service, while OPEX covers broader areas like marketing, R&D, and general administration. For SaaS companies, COGS often includes hosting fees, onboarding costs, support staff, and payment processing fees. These costs directly impact your gross margin, with many SaaS businesses targeting a 70–80%+ gross margin.
Headcount is typically the largest cost driver, with payroll making up 60–75% of total expenses. To model headcount costs accurately, plan for 1.2–1.3× the base salary to account for benefits, payroll taxes, and equipment. Understanding these costs at a granular level is crucial for forecasting profitability.
Unit Economics and Timing Assumptions
Metrics like Customer Acquisition Cost (CAC), Lifetime Value (LTV), and gross margin are essential for evaluating sustainability. Ideally, a SaaS company should aim for an LTV:CAC ratio of 3:1 and a payback period of less than 12 months. As Jeff Erickson from Forecastr puts it, "Managing a business without understanding your unit economics is like starting a long journey without a map." If your payback period exceeds 24 months, it’s a warning sign for investors.
Timing assumptions also play a major role. For example, sales hires often need three months to ramp up, while engineering roles might take 4–6 weeks to reach full productivity. Another useful approach is using a 3-month lagged CAC calculation, where customer acquisition costs from the previous quarter are used to evaluate current growth. These timing nuances can significantly impact when your profitability model predicts a break-even point, so getting them right at the outset is critical.
How to Build and Analyze Profitability Scenarios
Startup Profitability Scenarios: P10 vs P50 vs P90 Explained
How to Structure the Model
A solid profitability model has three key layers: Inputs (like pricing and churn assumptions), Calculations (the linking formulas), and Outputs (financial statements and scenario results). Keeping these layers separate is critical - if you hardcode numbers directly into formulas, updating assumptions becomes a massive headache.
To make your model easier to audit, color-code cells: pink/blue for inputs, black for formulas, and gray for outputs.
Take your cost analysis further by separating fixed costs (like rent and salaries) from variable costs (such as marketing and fulfillment). This allows you to calculate break-even points using the formula:
Fixed Costs ÷ (Unit Price – Variable Cost).
Focus on 2–4 key drivers that significantly impact your results. For SaaS startups, these often include new user signups, churn rate, and sales cycle length.
"The goal of your model is to provide clarity of thought and insight." - Villi Iltchev, Investor
For projections, use monthly estimates for the first 12–24 months and switch to annual estimates for years 3–5. If you're in the early stages, prioritize cash flow over accounting profit - what’s in your bank account determines survival, not theoretical earnings. This structured approach sets the foundation for testing different growth scenarios.
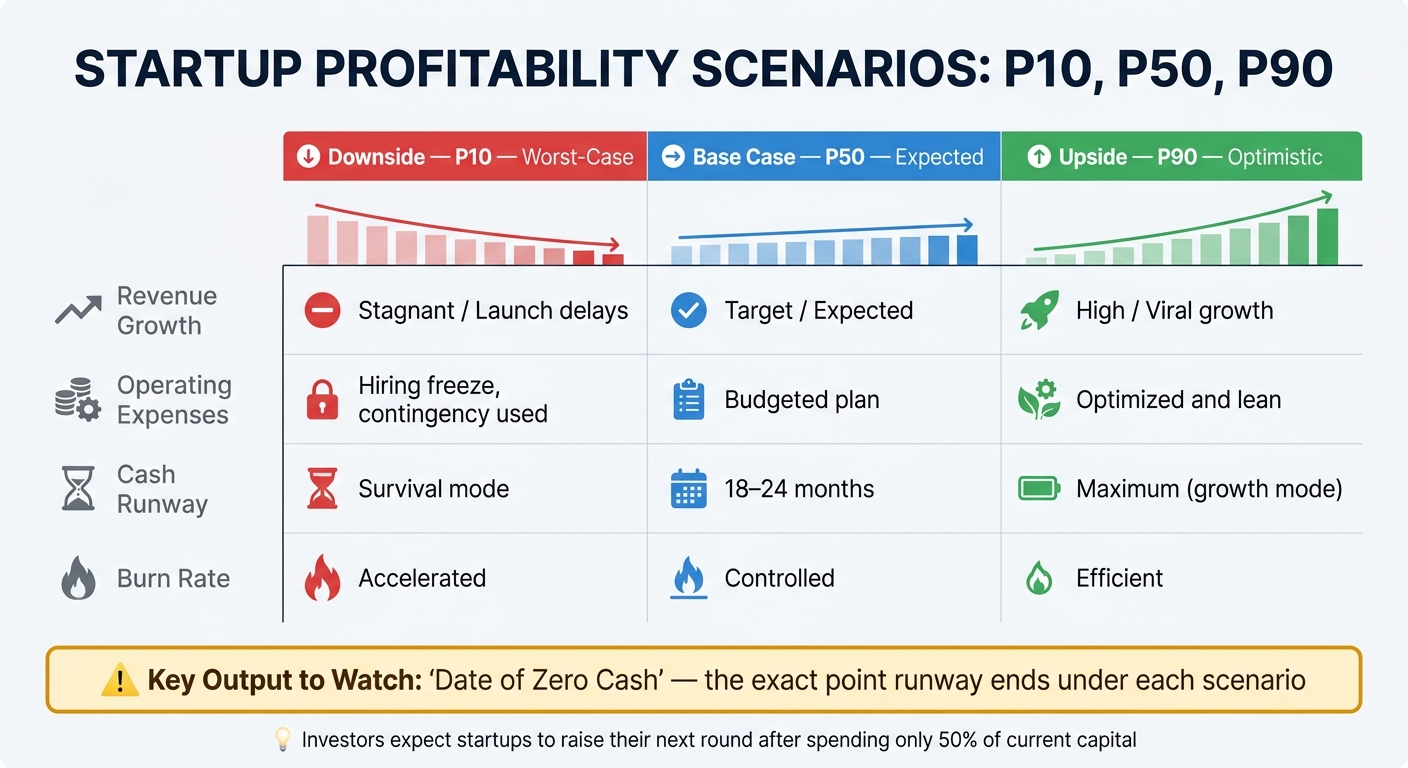
Comparing Base, Upside, and Downside Scenarios
Once your model is ready, create three scenarios to evaluate performance under different conditions. These are:
- Base Case (P50): Expected outcomes.
- Upside (P90): Optimistic growth.
- Downside (P10): Worst-case scenario, serving as an early warning system.
| Metric | Downside (P10) | Base Case (P50) | Upside (P90) |
|---|---|---|---|
| Revenue Growth | Stagnant / Launch delays | Target / Expected | High / Viral growth |
| Operating Expenses | Hiring freeze, contingency used | Budgeted plan | Optimized and lean |
| Cash Runway | Survival mode | 18–24 months | Maximum (growth mode) |
| Burn Rate | Accelerated | Controlled | Efficient |
One of the most critical outputs to monitor across all scenarios is the "date of zero cash" - the exact point when your runway ends under each condition. This date in the downside scenario is especially important, as it tells you when you’ll need to either cut costs or secure additional funding.
Investors typically expect startups to raise their next round after spending only 50% of their current capital. This means your downside scenario isn’t just a contingency plan - it’s a key guide for your fundraising timeline.
How to Apply Profitability Simulations
Using Simulations to Guide Key Decisions
Your three scenarios - P10, P50, and P90 - aren't just numbers; they’re tools to guide critical decisions. Think of the P10 scenario as your red flag. If this plays out, it might mean cutting costs immediately or even seeking additional funding. The P50 scenario? That’s your steady baseline for budgeting and hiring plans. And the P90 scenario? Use it as your stretch goal, something to aim for as you grow.
Simulations also help refine fundraising strategies. For example, if there’s a 25% chance you might run out of cash before hitting your next milestone, it could be a signal to increase your fundraising target by $500,000. Beyond operations and funding, simulations can sharpen your approach to the market, helping you make smarter decisions across the board.
Testing Pricing and Growth Strategies
Simulations aren’t just about keeping the lights on - they’re essential for fine-tuning pricing and growth strategies. By modeling a price increase, you can directly see how it impacts conversion rates, sales volume, and gross margins across your scenarios. For SaaS startups, even small shifts in metrics like churn rate or customer acquisition cost (CAC) can have a bigger impact on profitability than changes in operating expenses like hosting fees. Adjusting these inputs in your simulations can reveal where to focus your energy for the biggest payoff.
One crucial tip: make sure your growth model separates revenue recognition from actual cash collection. For example, if you offer net-30 payment terms or have annual contracts billed monthly, the timing of cash inflows won’t always match your recognized revenue. Mixing these up can lead to serious errors in your financial planning.
How Lucid Financials Simplifies Profitability Simulations
Juggling spreadsheets, emails, and disconnected tools to run profitability simulations can eat up precious time - time that early-stage founders can't afford to lose. Lucid Financials changes the game by combining AI-powered forecasting, precise bookkeeping, and CFO-level support into a single, streamlined platform. The result? Faster, smarter simulations without the usual headaches.
AI-Powered Scenario Modeling
Forget the manual errors and delays that come with traditional methods. Lucid Financials automates the entire simulation process, delivering forecasts, cash flow insights, and what-if scenarios directly from your live financial data. No more wrestling with outdated spreadsheets. When your revenue streams or expense assumptions shift, Lucid updates scenarios in real-time, ensuring you're always working with the most current data.
For startups in the pre-seed or seed stage, Lucid's CFO/Fundraising plan offers cash flow tracking, runway visibility, and dynamic scenario modeling - all for just $150 per month. That’s a fraction of what you'd spend on a part-time CFO, and it delivers faster, actionable insights that are critical for effective planning. Plus, this modeling seamlessly transitions into professional, ready-to-go reporting.
Investor-Ready Reporting
Turning simulation results into polished, investor-friendly reports can be a time drain. Lucid eliminates the hassle by generating board-ready reports and investor-grade forecasts with a single click. These reports pull directly from your live data, so whether you're preparing for a fundraising pitch or a board meeting, your financials are always accurate and presentation-ready - no extra formatting required. And because everything is built into the same platform, collaboration with your team becomes effortless, as detailed further below.
Slack-Based Support and CFO Guidance
Lucid integrates directly with Slack, making it easy for founders and their teams to stay on top of their financials without leaving their primary communication hub. Got a question about your burn rate or runway? Lucid's AI can provide instant answers, or you can tap into support from a real CFO team member for more complex issues.
The integration also allows visual financial models and dashboards to be shared directly within Slack conversations. This means your team can collaborate on budget planning or scenario reviews without needing to jump between tools.
"I used Lucidspark with my operations team in brainstorming sessions to identify pain points and inefficiencies in the financial servicing of one of our products." - Lou Beirle, Head of Finance, LeafLink
For founders who value speed and clarity, Lucid's Slack-based CFO guidance ensures quick, informed decisions without unnecessary roadblocks.
Conclusion: Using Simulations to Make Smarter Financial Decisions
Profitability simulations help you ask sharper questions before the stakes get too high. By modeling base, upside, and downside scenarios, you're doing more than just running numbers - you’re testing assumptions, spotting hidden risks, and understanding the key drivers behind your business.
Industry leaders emphasize this mindset:
"The founders who benefit most from AI financial modeling are those who use it to ask better questions, not those who use it to generate more precise-looking answers."
The real advantage comes when simulations become a regular habit. Frequent updates ensure your strategy stays flexible and responsive.
This is where tools like Lucid Financials make a difference. For $150 per month, Lucid's CFO/Fundraising plan offers dynamic scenario modeling, instant investor-ready reports, and real-time financial insights - helping even early-stage teams stay focused on growth. It’s a streamlined way to transform how financial decisions are made.
Building this habit early empowers founders to act decisively and confidently. In the end, it’s not about chasing perfect numbers - it’s about using effective modeling to guide smarter decisions.
FAQs
Which 2–4 inputs should I model first?
To get a clear picture of your startup's financial future, focus on these four essential inputs:
- Revenue projections: These are the foundation for estimating both profitability and how long your business can sustain itself financially.
- Customer churn or retention rates: Understanding how many customers stick around - or leave - is vital for assessing long-term profitability.
- Pricing assumptions: Your pricing strategy directly affects your revenue. Small adjustments can lead to big changes in outcomes.
- Cost structure (fixed and variable expenses): Knowing your expenses helps you evaluate cash flow in various scenarios.
These factors play a major role in shaping your business's financial outlook.
How do I estimate CAC, LTV, and payback with limited data?
To figure out Customer Acquisition Cost (CAC), Lifetime Value (LTV), and the payback period with limited data, startups can rely on scenario modeling and AI-based tools. Start by building projections for best-case, base-case, and worst-case scenarios using whatever data you have. Sensitivity analysis can help pinpoint which variables have the most impact, while forecasting models allow you to simulate potential outcomes. These estimates will become more accurate as additional data is collected over time.
How can I avoid mixing revenue recognition with cash collection?
To keep revenue recognition separate from cash collection, it's important to understand the difference between earning revenue and receiving cash. Revenue should be recognized when performance obligations are fulfilled - not when cash is collected. On the other hand, cash collection is all about the actual receipt of payments.
To manage this effectively, use distinct tracking systems for each process. This helps maintain clarity and avoids confusion. Additionally, financial modeling tools can be incredibly useful for simulating scenarios and planning accurately for both revenue recognition and cash flow management.