Building an investor-ready financial model boils down to turning your business plan into numbers that investors can trust. A solid model ties together your Income Statement, Balance Sheet, and Cash Flow Statement to show how your business makes money, manages costs, and plans for growth. Here's a quick breakdown:
- Purpose: Define if the model is for fundraising, budgeting, or valuation.
- Data: Use 3–5 years of financial history (or as much as you have) to identify trends.
- Assumptions: Centralize key inputs like pricing, growth rates, and costs.
- Revenue Forecasting: Use a bottom-up approach (detailed, data-driven) and validate with top-down estimates.
- Three-Statement Model: Link Income, Balance Sheet, and Cash Flow to show how decisions impact your financial health.
- Scenarios: Test base, best, and worst-case scenarios to prepare for uncertainties.
- Updates: Keep your model current with monthly or quarterly reviews.
Investors expect clarity and realistic projections. Tools like automated financial software can help streamline updates and ensure accuracy. A well-prepared model not only tracks your business performance but also builds trust and confidence with potential investors.
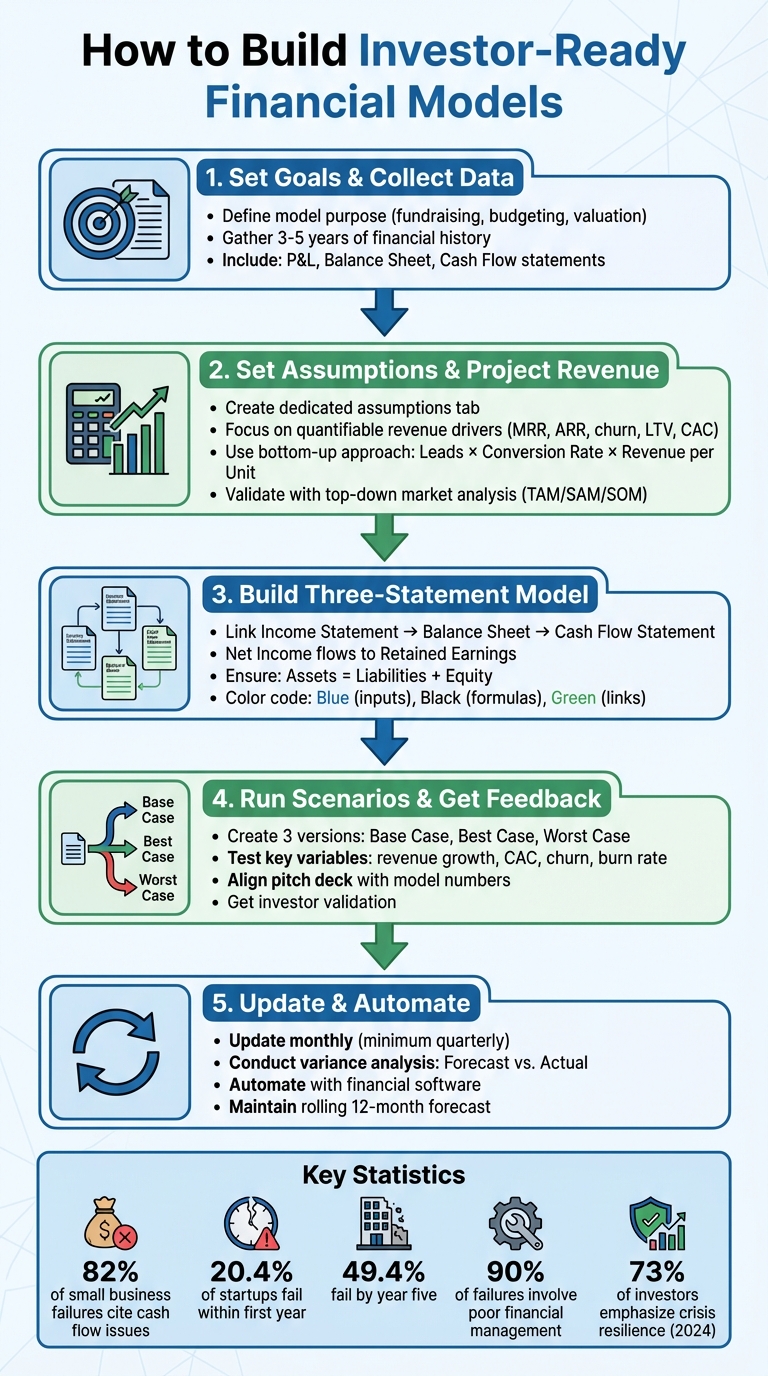
5-Step Process to Build Investor-Ready Financial Models
Step 1: Set Your Goals and Collect Past Financial Data
Identify What You Need the Model For
Start by defining the purpose of your financial model. Is it to demonstrate 18 months of runway for a Series A round? Plan internal budgets for the next quarter? Or support a valuation discussion? Your specific objective will shape how you design the model. For example, a fundraising model will emphasize milestones, while an operational model will focus on tracking budget-versus-actual performance and managing daily resources effectively.
"A financial model isn't a prediction machine, it's a decision tool. Show you understand what moves your business."
This quote from Matthew Powell, Fractional CFO and Founder of ModelPro, sums it up perfectly. Start with the decisions your model needs to support, then zero in on the key inputs that will drive those decisions. Once you’ve nailed down your model’s purpose, the next step is to back it up with comprehensive historical data.
Gather Your Historical Financial Statements
To build a realistic and reliable model, gather 3–5 years of financial data to identify trends and seasonal patterns. This includes your income statements (P&L), balance sheets, and cash flow statements for each year. Even if you’re a startup with limited history, using actual data adds transparency and sets realistic expectations.
But don’t stop at the main financial statements. Dive deeper by collecting detailed records on revenue streams, cost of goods sold (COGS), department-level operating expenses, and working capital components like accounts receivable and payable. For industry-specific metrics, include data like MRR, churn, and CAC for SaaS businesses, or inventory levels and AOV for eCommerce companies. Also, keep tax returns, capitalization tables, and liability lists handy - these are often requested by investors and lenders. Store everything in a shared data room for easy access.
Once you’ve gathered your data, organize it systematically. Use separate tabs in your spreadsheet for raw historical data, assumptions, calculations, and final outputs. To streamline reviews, mark historical figures in blue and formulas in black. Add automated checks, such as ensuring your balance sheet balances (Assets = Liabilities + Equity) for every period, to catch errors before they’re noticed by investors.
sbb-itb-17e8ec9
Step 2: Set Your Assumptions and Project Revenue
Set Your Core Assumptions
Assumptions form the backbone of your financial model. Start by creating a dedicated assumptions tab to centralize all critical inputs - like pricing, growth rates, conversion metrics, and cost factors.
Focus on quantifiable revenue drivers. For SaaS businesses, this typically includes metrics like Monthly Recurring Revenue (MRR), Annual Recurring Revenue (ARR), churn rates, Customer Lifetime Value (LTV), and Customer Acquisition Cost (CAC). Break down your growth into measurable components: acquiring new customers, generating upsell or cross-sell revenue, handling downgrades, and accounting for churn.
"Every revenue line must have a driver you can measure. If an investor can't trace a number back to a business action, a customer, a price point, or a usage metric, it doesn't belong in the model." - Lior Ronen, Founder, Finro Financial Consulting
Base your assumptions on actual data. Use industry benchmarks to validate your metrics. For instance, early-stage SaaS companies often see visitor-to-trial conversion rates between 3% and 5%. In 2024, Dollar Cave Club, a subscription service, modeled its assumptions using a $29.99 monthly subscription price and a 4% churn rate. Using historical data and SUBTA benchmarks, they determined they needed 400 new subscribers monthly to maintain their base of 10,000 customers. Compare your gross margins, R&D spending, and revenue per employee against industry norms to ensure your assumptions are realistic.
Separate your fixed costs (like rent and fully loaded labor) from variable costs (such as materials, commissions, and hosting). Adjust these for inflation and growth. Keep your assumptions streamlined - professional models typically stick to fewer than 20 core assumptions, focusing only on what truly drives the business.
Once you’ve nailed down your assumptions, use them as the foundation to build a precise revenue forecast.
Create Your Revenue Forecasts
Build your revenue forecast using a bottom-up approach. Multiply your expected leads by conversion rates and revenue per unit. For example, if you project 100 leads, a 20% conversion rate, and $1,000 revenue per unit, you’d forecast $20,000 in revenue.
In April 2020, Southeast Inc, a SaaS company servicing airports, applied this method to manage its $700,000 MRR. The company tracked customer acquisition closely, averaging 14–28 new customers per month with an average revenue per customer of $1,239. Using a three-month "Autopilot" average, they projected 20 new customers monthly, adding $24,773 in new MRR. This granular data helped them pinpoint marketing funnel improvements and move toward cash flow positivity.
"A bottom-up model is more powerful, detailed, and comprehensive. In this model, you start with granular assumptions that drive revenue and build on each other." - Anthony Millin, Founder and Co-chair of NEXT
While the bottom-up approach is detailed and data-driven, it’s important to validate it with a top-down sanity check. Use TAM (Total Addressable Market), SAM (Serviceable Addressable Market), and SOM (Serviceable Obtainable Market) estimates to ensure your projections align with market realities. Investors tend to trust bottom-up models because they demonstrate a clear understanding of sales mechanics and strategic thinking.
Account for timing and seasonality in your forecasts. Think about the length of your sales cycle and any seasonal demand shifts that could impact revenue recognition. For SaaS businesses, use the ARR waterfall framework: Beginning ARR + New Logo ARR + Expansion ARR - Contraction ARR - Churn ARR = Ending ARR. Run sensitivity analyses with different scenarios - base, optimistic, and pessimistic - testing your business’s resilience at 50% or 25% of projected revenue. This will help you determine the minimum capital needed to stay afloat.
A Startup Financial Model that Investors Love (use our template!)
Step 3: Build a Three-Statement Financial Model
Once your revenue forecasts are set, the next step is to integrate your income statement, balance sheet, and cash flow statement into a single, dynamic model. This comprehensive framework demonstrates to investors how your decisions impact the overall health of your business.
"A three-statement model links the income statement, balance sheet, and cash flow statement into one dynamically connected financial model." – Jeff Schmidt, Corporate Finance Institute
The integration works through specific linkages. For example, net income from your income statement flows into retained earnings on your balance sheet and becomes the starting point for your cash flow statement. Depreciation, which reduces net income, is added back as a non-cash expense on the cash flow statement and decreases PP&E on the balance sheet. Additionally, changes in working capital - like accounts receivable, inventory, and accounts payable - connect accrual-based net income to actual cash movement.
To ensure your model is accurate, the ending cash balance on your cash flow statement should match the cash line on your balance sheet. This alignment confirms that Assets equal Liabilities plus Equity. Building separate schedules for depreciation, PP&E, and debt can help streamline complex calculations before you finalize your statements.
"Think of the income statement as the horse and the balance sheet as the carriage. The income statement assumptions are driving the balance sheet forecasts." – Wall Street Prep
For clarity and usability, follow standard color-coding conventions: use blue for hard-coded inputs, black for formulas, and green for links between worksheets. Avoid circular references by creating a dedicated interest schedule tied to beginning-of-period debt.
Let’s break down how to project each statement to complete your integrated model.
Project Your Income Statement
Start with your revenue forecasts from Step 2 and work through your operating expenses to calculate net income. Separate COGS (the direct costs of producing your product or service) from operating expenses like SG&A.
Here’s the flow:
- Subtract COGS from revenue to determine gross profit.
- Deduct operating expenses to calculate EBITDA.
- Subtract depreciation to arrive at EBIT.
- Finally, deduct interest and taxes to calculate net income.
Use assumptions from your assumptions tab to guide these projections. To demonstrate long-term financial health, aim to project at least five years of annual income statements.
Build Your Balance Sheet
The balance sheet captures the results of your income statement, providing a snapshot of your financial position at a specific point in time. Assets (what you own) are listed on the left, while liabilities (what you owe) and equity (what’s left for shareholders) are on the right.
Here’s how to build it:
- Link net income to retained earnings under the equity section.
- Project current assets - like cash, accounts receivable, and inventory - using collection and turnover assumptions.
- On the liabilities side, calculate accounts payable based on operating expenses and payment terms. Add any debt from your financing schedule, ensuring principal repayments are correctly linked.
Always confirm that the balance sheet equation holds true: Assets = Liabilities + Equity. An automated check cell can help identify any linking errors.
Create Your Cash Flow Statement
The cash flow statement ties everything together by reconciling accrual-based net income with actual cash movement. It’s divided into three sections: Operating Activities, Investing Activities, and Financing Activities.
Here’s a quick breakdown:
- Operating Activities: Start with net income, add back depreciation, and adjust for changes in working capital. For instance, an increase in accounts receivable is a cash outflow, while an increase in accounts payable is a cash inflow.
- Investing Activities: Record CapEx as cash outflows.
- Financing Activities: Track debt issuances, repayments, equity raises, and dividend payments.
Finally, add the net change in cash to the prior period’s closing cash balance. This total should match the cash balance on your balance sheet for the model to be accurate.
A real-world example of this in action: During the pandemic, Science On Call - a restaurant-tech startup co-founded by Luisa Castellanos - moved to a three-statement financial model. This approach improved their decision-making and helped them secure a $1.1 million pre-seed SAFE round in 2020–2021.
Step 4: Run Scenarios and Get Investor Feedback
Now that your three-statement model is ready, it’s time to put it through its paces. The goal? Test its limits and refine it based on feedback from investors. No forecast is set in stone. Markets evolve, competitors appear, and customer preferences shift. That’s why investors want to see multiple outcomes - not just the one you’re hoping for.
Run Scenario and Sensitivity Analysis
Start by creating three versions of your model: base case, best case, and worst case.
- The base case represents your most realistic expectations, based on current growth trends and reasonable assumptions.
- The best case imagines everything going better than planned - your product takes off, or a marketing campaign exceeds expectations.
- The worst case anticipates challenges like a market slowdown, higher churn, or a sudden drop in demand.
Focus on the variables that matter most: revenue growth, customer acquisition costs, churn rates, and monthly cash burn. For example, during the Spring 2020 travel slump, Airbnb prepared for a "Travel Shock" scenario where revenue could drop by over 50%. While their actual revenue for the year fell by about 30% ($3.4 billion compared to $4.8 billion in 2019), they were ready with contingency plans. By cutting 1,900 jobs (25% of their workforce) and raising emergency funding, Airbnb managed to stabilize cash flow and pivot toward longer-term stays faster than their base case anticipated.
To dig deeper, use sensitivity analysis. Adjust one variable at a time - like testing how a 10% price hike or a 20% dip in conversion rate affects your cash runway. This approach helps you understand the ripple effects of small changes.
Get Investor Feedback on Your Model
Investors don’t expect your model to be flawless, but they do expect it to be practical and insightful. One surefire way to lose their confidence? Presenting pitch deck numbers that don’t align with your financial model. For example, if your slides project $2 million in revenue but your model shows $1.5 million, it raises doubts about your understanding of the business.
Make sure your assumptions align with industry standards. For SaaS companies, that might mean ensuring your LTV:CAC ratio is reasonable. In e-commerce, it could be average order value or repeat purchase rates. Back up every assumption with data or reliable benchmarks. In fact, by 2024, 73% of investors emphasized the importance of startups building resilience against future global crises. Showing that you’ve considered multiple scenarios demonstrates you’re ready to handle uncertainty and adapt as needed.
Once your assumptions and scenarios are validated, consider automating your workflow to save time and ensure accuracy.
Use Lucid Financials for Real-Time Reporting

Lucid Financials simplifies reporting and provides AI-driven forecasts using live data. Forget the hours spent updating Excel spreadsheets - this tool generates investor-ready reports and forecasts instantly.
Lucid connects directly with Slack, so you can ask about metrics like runway, burn rate, or scenario impacts and get instant answers from its AI, which is backed by finance professionals. The platform updates your financials in real time, keeping your model accurate whether you’re hiring, fundraising, or adjusting spending. For startups gearing up for fundraising, Lucid offers CFO-level support, including AI-generated hiring plans, cash flow projections, and scenario modeling to keep you prepared.
"Building scenario-based forecasts lets you get ahead of the data instead of reacting to it." – Jaakko Piipponen, Founder
With Lucid, your financial model becomes more than just a spreadsheet - it’s a dynamic decision-making tool that evolves with your business.
Step 5: Keep Your Model Updated and Automated
A financial model isn’t something you create once and forget. It needs to evolve with your business. Keeping it up-to-date ensures it reflects current realities, builds trust with investors, and helps you make informed decisions - all without eating up too much of your time.
Update Your Model Regularly
Monthly updates are a good rule of thumb. This schedule gives you a clear picture of your cash runway and burn rate, while also helping you spot potential problems early. Did you know that 82% of small businesses that fail cite cash flow issues as a major reason? Often, they don’t realize there’s a problem until it’s too late.
Each month, conduct a variance analysis by comparing your actual performance to your forecasts. For instance, if you expected $50,000 in revenue but only earned $42,000, dig into the gap. Was it a delayed payment, or did a deal fall through? Use what you learn to refine your assumptions going forward. Dave Lishego, Senior Financial Analyst at Carnegie Mellon University, emphasizes the value of maintaining a rolling 12-month forecast:
"With each passing month, you extend your forecast by one month. You always want to be able to look twelve months in advance".
At the very least, aim for quarterly reviews - even if your business feels stable. Markets shift, and customer behaviors evolve. Regular updates not only keep your model accurate but also make it easier to transition to automated systems when the time comes.
Automate with Financial Software
Once you’ve nailed the habit of regular updates, take it a step further by automating the process. Manual data entry is time-consuming and prone to mistakes. Instead, connect your financial model directly to your accounting software - tools like QuickBooks or Xero can pull data automatically, keeping everything accurate and up-to-date.
Lucid Financials is an example of how automation can transform your workflow. It syncs with your accounting data to generate real-time forecasts and keeps investor-ready reports updated automatically. You can even ask questions in Slack - like "What’s our current runway?" or "How would a 15% price hike impact cash flow?" - and get instant, AI-powered answers supported by financial experts. For startups preparing for board meetings or fundraising, Lucid offers CFO-level tools like automated hiring plans, cash flow projections, and dynamic scenario modeling.
If you’re still relying on spreadsheets, consider standardizing your approach with a color-coding system to simplify reviews and reduce errors. For example:
- Blue for manual inputs
- Black for formulas
- Green for references to other sheets
As your business grows, scaling up to an automated financial management platform will give you integrated planning capabilities and real-time insights, helping you stay ahead.
Conclusion
An investor-ready financial model showcases your command over your business's financial workings and proves you can make informed decisions with investor funds. By following the steps outlined earlier, you can craft a model that is clear, precise, and rooted in realistic expectations. A well-constructed model not only tracks the flow of capital but also lays the groundwork for transparent and reliable financial communication.
Startup failure rates highlight the importance of financial discipline: 20.4% fail within the first year, and 49.4% by year five, with poor financial management being a factor in 90% of these failures. These statistics make it essential to keep a close eye on critical metrics like burn rate, customer acquisition costs, and cash runway. Being diligent about these numbers prepares you to seize growth opportunities while mitigating risks.
Accuracy and transparency are equally crucial. By clearly distinguishing inputs, calculations, and outputs, you allow investors to review your logic and tweak assumptions as needed. A messy spreadsheet signals a lack of strategic clarity, while a clean, well-organized model that aligns with your pitch deck shows operational control and strategic insight. This is especially important in 2024, as 73% of investors emphasize the need for startups to strengthen their resilience against future crises.
Think of your financial model as a living document rather than a static tool for fundraising. Monthly updates comparing forecasts with actual performance ensure your data remains relevant and actionable. These updates allow for quick, informed decisions - whether you're navigating a downturn or scaling rapidly. They also help refine your strategy and consistently build investor trust. Tools like Lucid Financials can simplify this process, offering real-time reporting and CFO-level insights without the hassle of manual updates.
When your financial model is clear, accurate, and consistently updated, it becomes a critical tool for steering your business and assuring investors that their capital is in capable hands.
FAQs
What financial metrics do investors care about most?
Investors focus on metrics that showcase a company's growth, profitability, and financial health. Some of the key indicators they look at include:
- Revenue growth: A clear sign of how quickly a business is expanding.
- Gross margin: Reflects how efficiently a company manages its production costs relative to revenue.
- Customer acquisition cost (CAC): Shows how much it costs to gain a new customer, which ties directly to marketing efficiency.
- Lifetime value (LTV): Highlights the total revenue a business can expect from a customer over their relationship with the company.
- Cash runway: Indicates how long the company can operate with its current cash reserves.
These metrics give investors a snapshot of a business’s potential, operational effectiveness, and its ability to stay afloat in the long run.
How do I avoid circular references in a three-statement model?
To deal with circular references in a three-statement financial model, start by pinpointing the source of the loop - common culprits include interest expense or taxes. Once identified, break the loop by substituting the problematic formula with a hardcoded value. You can achieve this manually through copy/paste or automate it using a macro.
Repeat this process until the model stabilizes and delivers consistent results. By addressing circular dependencies in this way, you ensure the calculations remain accurate without compromising the functionality of the model.
How much cash runway should my model show for fundraising?
A well-structured financial model should show that your business has enough cash to operate for 12 to 18 months. This timeframe provides a safety net for managing day-to-day operations, planning for growth, and navigating the fundraising process without unnecessary pressure. A clear, detailed model not only reflects your company’s financial stability but also gives investors confidence in your ability to manage resources effectively.