Boards need financial reports that go beyond numbers. These reports should connect financial data to business strategy, helping guide decisions on growth, profitability, and fundraising. Standard reports often fail to provide this context, but custom reports - powered by AI tools - can bridge the gap.
Here’s how to create reports that deliver actionable insights:
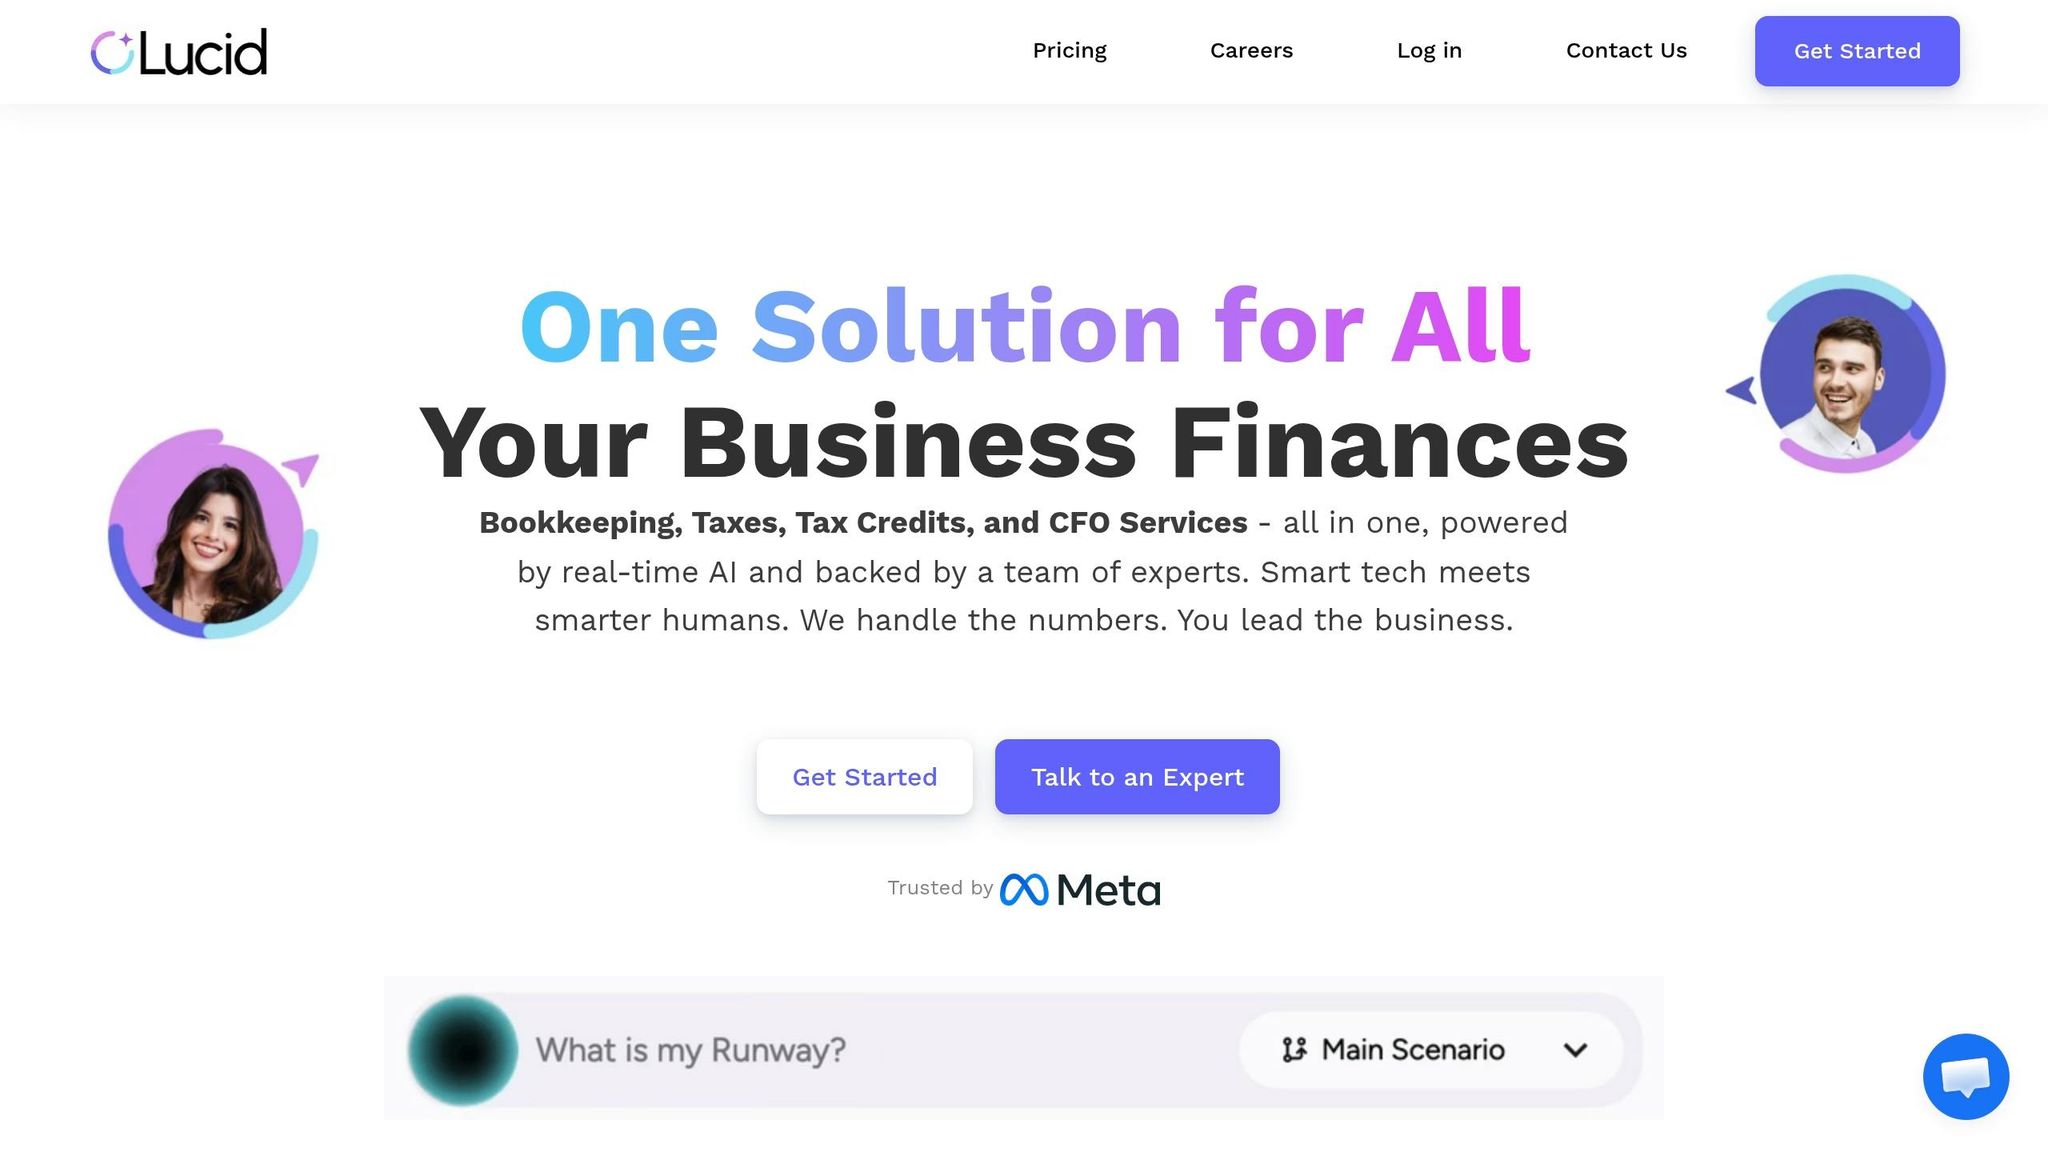
- Organize your financial data: Start with accurate, up-to-date data from key sources like accounting software and payroll systems. Tools like Lucid Financials automate this process, saving time.
- Select relevant metrics: Choose KPIs that align with your board’s priorities. For example:
- Growth-focused boards: Revenue growth, MRR, CAC, churn.
- Profit-focused boards: EBITDA margin, expense-to-revenue ratio.
- Fundraising boards: Burn rate, cash runway, LTV:CAC ratio.
- Leverage AI tools: Automate report creation with templates, charts, and narratives. AI can generate forecasts, scenario analyses, and variance explanations in minutes.
- Customize and share: Tailor visuals, ensure accuracy, and distribute reports in formats like PDFs or dashboards. Automate updates to keep reports current.
AI-powered tools like Lucid Financials streamline the entire process, turning complex financial data into clear, board-ready reports in less time. With the right approach, you can equip your board with insights that drive better decisions.
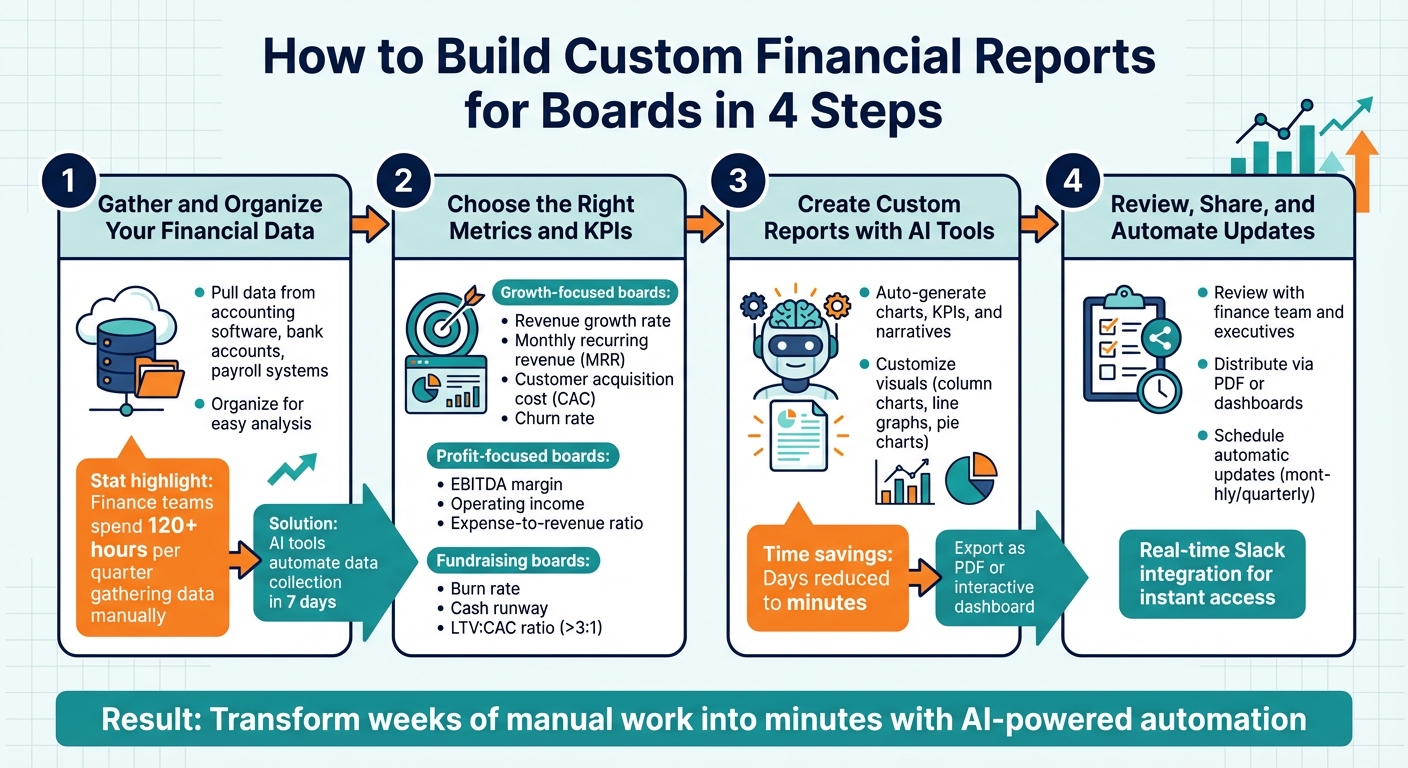
4-Step Process to Build Custom Financial Reports for Boards with AI
How to Create Effective Board Reports for Startups and Scale-Ups | CFO Insights
sbb-itb-17e8ec9
Step 1: Gather and Organize Your Financial Data
Creating strong board reports starts with having accurate and up-to-date financial data. Before diving into analysis, you need to collect raw data from various sources - like your accounting software, bank accounts, payroll systems, and expense tracking tools. Once gathered, this data should be organized in a way that makes it easy to analyze. This foundation is essential for identifying the right metrics in the next steps.
Streamlining Data with Lucid Financials
Manually collecting financial data can be a huge time sink. On average, finance teams spend over 120 hours each quarter just gathering data manually. Lucid Financials simplifies this process by combining bookkeeping, tax services, and CFO support into a single smart platform. It automatically pulls transaction data, matches entries, and reconciles accounts in real time. Within just seven days, you’ll have organized, clean books that are ready for analysis. Plus, with its Slack integration, you can instantly check your financials - whether it’s your cash position or last month’s burn rate - without sifting through endless spreadsheets.
Essential Data for Board Reports
Focus on the core financial documents: the Income Statement (P&L), Balance Sheet, and Cash Flow Statement. These give a full picture of profitability, assets, and liquidity. Key metrics to include are revenue growth, EBITDA, profit margins, cash position, burn rate, and runway. To provide deeper insights, add budget vs. actual data, showing both dollar amounts and percentage variances. For operational relevance, include metrics like customer acquisition cost (CAC), lifetime value (LTV), churn rate, and headcount. These connect financial outcomes to business performance. Once your data is organized and these metrics are clear, you’ll be ready to select the right KPIs and customize your board report with the help of AI tools.
Step 2: Choose the Right Metrics and KPIs
When presenting to your board, focus on metrics that address the most pressing questions: Are you growing? Do you have enough cash? Are you hitting your targets? The metrics you select should directly support these critical decisions.
Standard Metrics vs. AI-Generated Insights
Traditional reports rely on historical data, like year-to-date (YTD) revenue, EBITDA margin, cash position, and accounts receivable or debt. While valuable, these reports often lack the ability to look ahead.
AI-generated insights change the game by offering predictive capabilities. For instance, AI can provide a 13-week cash flow forecast with sensitivity analysis, helping you spot potential liquidity challenges before they arise. It also generates scenario projections - base case, optimistic, and pessimistic - based on factors like pipeline conversion rates or customer churn. Deviations of ±10% are flagged and explained, giving you actionable insights.
| Aspect | Standard Metrics | AI-Generated Insights |
|---|---|---|
| Focus | Historical (e.g., YTD revenue, EBITDA margin) | Predictive (e.g., cash flow forecasts, scenarios) |
| Timeliness | Requires periodic updates | Real-time and automated |
| Flexibility | Fixed charts and tables | Interactive dashboards with scenario adjustments |
| Depth | Summary-level data (e.g., basic cash flow) | Detailed narratives with variance explanations |
These forward-looking insights allow you to align metrics more closely with your board’s strategic goals.
Matching Metrics to Board Goals
The priorities of your board should guide your choice of metrics. For boards focused on growth, emphasize KPIs like:
- Revenue growth rate (year-over-year or quarter-over-quarter)
- Monthly recurring revenue (MRR)
- Customer acquisition cost (CAC)
- Churn rate
- Sales pipeline conversion rates
For boards more concerned with profitability, focus on:
- EBITDA margin
- Operating income
- Expense-to-revenue ratio
- Budget versus actual variances
For example, if your EBITDA margin declines over three consecutive quarters, it’s a clear signal to discuss inefficiencies and explore cost-saving measures.
If your company is preparing for fundraising, the board will likely prioritize metrics such as:
- Burn rate
- Cash runway (in months)
- Unit economics, like an LTV:CAC ratio greater than 3:1
- Clean financial statements that demonstrate scalable growth
AI tools like Lucid Financials can simplify this process by analyzing your data, aligning it with your goals, and generating tailored, investor-ready KPIs directly in platforms like Slack. These metrics form the backbone of an AI-driven, board-ready report. From here, you can integrate these insights into a dynamic, custom report tailored to your board’s needs.
Step 3: Create Custom Reports with AI Tools
Once you've identified your key metrics, it's time to turn them into reports that clearly communicate the story behind the numbers. Thanks to AI tools, you can skip the tedious tasks like formatting spreadsheets, building charts, or drafting narratives. Instead, you can focus on presenting dynamic, polished visuals that are ready for your board.
How Lucid's AI Simplifies Report Creation
Lucid Financials streamlines the entire reporting process by pulling real-time data directly from your accounting systems. Within seven days of setup, the platform generates essential financial statements, executive summaries, key performance indicators (KPIs), and variance analyses. No more copying numbers from QuickBooks or manually creating charts - Lucid does the heavy lifting for you.
Here's how it works: Log in to the Lucid platform, connect your data sources, and click "Generate Board Report." Choose a template - whether it's for P&L summaries, cash flow forecasts, or KPI dashboards - and let the AI populate it with your latest numbers. For instance, it might include figures like $5M YTD revenue compared to $4.2M last year, a 25% EBITDA margin, or $2M in cash on hand. The AI also drafts narratives explaining trends, such as a 15% quarter-over-quarter increase in marketing spend. You can review these details, make adjustments if needed, and export the final report as a PDF or an interactive dashboard. What used to take days now takes just minutes.
Customizing Charts and Layouts
Once the automated report is ready, you can tweak its visual elements to suit your board's preferences. Lucid's AI generates visuals like column charts for revenue, line graphs for year-over-year trends, pie charts for expenses, and quadrant diagrams for profit and loss. These visuals are far more effective than dense tables when presenting trends - like a steady decline in margins over three quarters.
Tailor these visuals to meet your board's expectations and align with US formatting standards. For example, you can adjust color schemes to highlight key variances, resize charts for emphasis, or reorder sections to create a logical flow - starting with KPIs and following with supporting details. Use US-specific formats such as $1,234,567.89 for numbers and MM/DD/YYYY for dates to maintain consistency. One company, for instance, transformed a standard cash flow forecast into a 13-week line graph with color-coded markers highlighting variances over 10%. They also added base case and pessimistic scenarios, which sparked a meaningful discussion about liquidity risks and led to a $1M funding adjustment.
Lucid goes a step further with recurring automation. You can schedule weekly updates to keep your custom layouts current. The AI refreshes charts with the latest data - like updated accounts receivable or payable - while preserving your edits. Notifications let you know when the updated reports are ready, ensuring your board always has access to the most up-to-date financial insights.
Step 4: Review, Share, and Automate Updates
Once your report is ready, the next step is to ensure it’s accurate, accessible, and consistently updated without requiring extra manual effort. Here's how to make that happen:
Review Reports with Your Team
Start by reviewing the report internally with key stakeholders like finance teams, departmental leaders, and executives. This step ensures the data is accurate, clear, and aligned with your goals. An effective CFO board report typically includes:
- Executive summaries
- Financial statements
- Key performance indicators (KPIs)
- Variance analyses
- Risk management insights
- Actionable recommendations
After your team confirms the report’s accuracy and relevance, you’re ready to share it with the board.
Distribute Reports to Board Members
Once the internal review is complete, distribute the report securely and in a timely manner. Use formats that cater to different needs - PDFs for a static, archived version and interactive dashboards for those who prefer to explore the data in detail. Always include a cover page summarizing the report date, executive summary, and table of contents for quick navigation.
Lucid Financials makes this process smoother with its Slack integration. This feature facilitates real-time communication, allowing you to share updates, answer questions quickly, and provide context without waiting for formal meetings. Board members can review the reports on their own schedules, ensuring everyone stays informed and aligned.
Set Up Automatic Report Updates
To save time and ensure consistency, automate your reporting process. Lucid Financials allows you to schedule report generation - whether monthly, quarterly, or as needed. It pulls data directly from your accounting system into pre-built templates and distributes the reports via email or secure portals on a set schedule.
Automated reports should cover critical metrics like:
- Revenue and net income trends (Year-To-Date vs. prior year)
- EBITDA margin
- Cash position updates
- Budget vs. actual comparisons with variance analysis
- Cash flow forecasts (often 13-week projections)
- Rolling forecasts with updated full-year projections and key assumptions
Lucid also ensures version control by marking reports with generation dates and timestamps, so board members always know they’re looking at the most recent data. For significant events, like unexpected revenue shifts or cash flow changes, you can trigger immediate updates while maintaining your regular reporting schedule. This approach ensures every board meeting is backed by current, actionable financial insights.
Conclusion
Benefits of Custom, AI-Powered Financial Reports
Creating custom financial reports for your board eliminates the need for manual labor and expensive external support. In just four steps, you can transform tasks that once took weeks into something manageable in minutes.
Custom reports offer more than just numbers - they provide tailored visuals, KPI dashboards, and variance analyses that align directly with your strategic goals. Unlike generic templates that often hide key insights in overwhelming spreadsheets, AI-powered reports transform complex financial data into straightforward narratives. These reports clearly link your numbers to your company’s growth strategy, fostering trust and keeping board discussions focused on what truly matters: driving your business forward.
For startup founders, the time savings are game-changing. Instead of spending hours consolidating data and formatting charts, you can focus on scaling your business. Lucid Financials simplifies the process by automating data consolidation and report generation, with real-time answers available through Slack integration. From bookkeeping and tax preparation to CFO-level forecasting, the platform ensures accuracy and compliance, backed by experienced professionals.
This streamlined approach makes moving from planning to execution smooth and efficient.
Get Started with Your First Custom Report
To begin, connect your data to Lucid Financials for automatic consolidation. Choose board-relevant KPIs - such as year-to-date revenue compared to the prior year, cash position, and budget-to-actual metrics - and let AI-powered templates generate a draft report. Customize charts to fit your board’s preferences, review the draft with your team, and share it directly through Slack.
With Lucid’s AI handling the tedious work and experts ensuring every detail is correct, you’ll have more time to focus on what matters most: growing your business and staying prepared for any critical investor discussions.
FAQs
What should I include in a board-ready financial report?
A financial report designed for board members should cover the essentials: income statements, cash flow details, and key performance indicators (KPIs) like cash runway, burn rate, revenue, expenses, and profitability forecasts. To make the data digestible, use visual aids such as graphs and dashboards, which can break down complex information at a glance.
Including real-time data and leveraging AI tools can enhance both accuracy and timeliness. These elements ensure the report is not only clear and engaging but also equips stakeholders with the insights they need to make well-informed decisions.
How do I choose KPIs that match my board’s priorities?
When selecting metrics to monitor, it’s crucial to align them with your company’s current stage, goals, and the interests of your stakeholders. Here are a few actionable KPIs that can provide meaningful insights:
- Cash Burn Rate: This measures how quickly your company is spending cash. It’s especially important for investors who want to understand liquidity and runway.
- Revenue Growth: A clear indicator of business momentum, this metric helps stakeholders gauge how quickly your company is scaling.
- Customer Acquisition Costs (CAC): This shows how much you’re spending to bring in each new customer. It’s a key efficiency metric for both investors and internal teams.
- Customer Lifetime Value (CLV): Understanding the long-term value of a customer helps balance acquisition costs and revenue potential.
- Monthly Recurring Revenue (MRR): For subscription-based businesses, this metric provides a consistent snapshot of revenue health.
- Churn Rate: Keeping an eye on how many customers you’re losing can highlight retention issues and areas for improvement.
- Gross Margin: This reflects profitability and operational efficiency, offering a high-level overview for board members.
To ensure these metrics remain relevant, automate data collection for accuracy and consistency. Regularly - ideally quarterly - review and adjust your KPIs to stay aligned with shifting priorities and stakeholder needs. This proactive approach ensures your metrics remain actionable and insightful.
How can I automate board reports without sacrificing accuracy?
Automating board reports is now easier and more accurate with AI-driven tools like Lucid Financials. These tools simplify the process by handling data collection, formatting, and report creation, significantly cutting down on manual tasks and reducing errors. With features such as real-time dashboards and dynamic templates, they ensure that board members receive timely, precise, and customized insights. Additionally, Lucid Financials seamlessly integrates with platforms like Slack, delivering real-time updates and investor-ready reports with minimal effort.