A single company-wide forecast is often too blunt for B2B sales. If you split customers into small groups based on how they buy, then train a separate AI forecast for each group, you can cut forecast error in a big way. One case in the article showed RMSE dropping from 238.18 to 61.57, a 74% drop.
Here’s the short version:
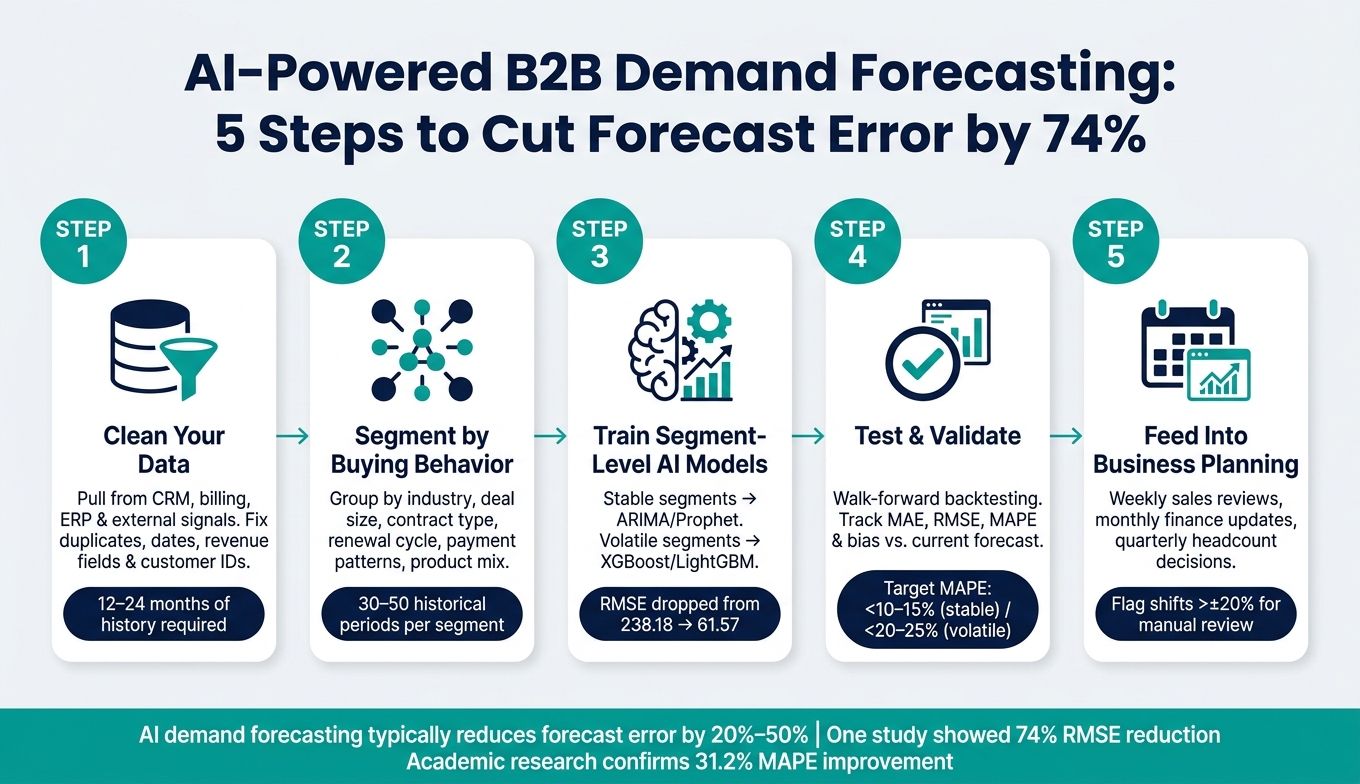
- Clean your data first. Pull data from CRM, billing, ERP, and outside signals. Then fix duplicates, dates, revenue fields, and customer IDs.
- Build segments around buying behavior. Group customers by things like industry, deal size, contract type, renewal cycle, payment patterns, or product mix.
- Train one forecast per segment. Stable segments may fit time-series models. Volatile segments may fit models like XGBoost or LightGBM.
- Test against a baseline. Use walk-forward backtesting and track MAE, RMSE, MAPE, and bias.
- Use the forecast in planning. Feed it into weekly sales reviews, monthly finance updates and real-time insights, and headcount decisions. Review large swings by hand.
A few numbers stand out:
- AI demand forecasting often cuts error by 20% to 50%
- A model should usually have at least 12–24 months of history
- Try to keep 30–50 historical periods per segment
- For stable segments, a rough target is MAPE below 10%–15%
- For newer or more volatile segments, 20%–25% can still be fine
| Step | What I’d focus on | What it helps answer |
|---|---|---|
| Data prep | Clean records, shared customer IDs, common time periods | “Can I trust the inputs?” |
| Segmentation | Group by buying patterns | “Which customers behave alike?” |
| Modeling | Fit one model per segment | “What is each group likely to buy next?” |
| Validation | Compare vs. current forecast | “Is this better than what I use now?” |
| Planning | Apply results to sales and cash planning | “What should I do with this forecast?” |
The core idea is simple: don’t force very different deals into one forecast. If enterprise, SMB, renewals, and event-driven deals move in different ways, they should not be modeled as one lump. That’s the main reason segment-level AI forecasts can be more accurate and more useful.
AI-Powered B2B Demand Forecasting: 5-Step Process to Cut Forecast Error by 74%
Revolutionizing Demand Forecasting and its Enterprise Impact using Causal AI and Agents
sbb-itb-17e8ec9
Step 1: Prepare Clean Data for AI Forecasting
Before you model anything, clean the data.
That step matters because AI tends to amplify whatever is already in your CRM, billing, and finance systems. If those records are messy, your forecast gets messy too.
Collect Internal and External Demand Signals
Start with the signals that show how customers buy.
From your CRM, pull:
- Account details like industry, company size, and region
- Opportunity stages, expected close dates, and deal values
- Win/loss results from at least the past 12–24 months
From your billing and subscription tools, export invoices, MRR/ARR by customer, subscription start and end dates, upgrade and downgrade events, and cancellation reasons.
From your order management or ERP, gather order dates, product SKUs, quantities, unit prices, discounts, and payment terms.
Then add outside signals that can shift demand, such as budget cycles, holidays, and macro indicators.
Lucid Financials centralizes bookkeeping, invoices, tax data, and CFO reporting, which makes clean financial signals easier to feed into forecasts.
Once all of those signals sit in one place, standardize them before modeling.
Standardize Time Periods, Customer Records, and Financial Fields
Start by fixing duplicates.
Merge accounts that share the same legal name, domain, or tax ID, and assign one customer ID across CRM, billing, and finance systems. If one customer shows up three different ways in three different tools, your model will treat that like three customers. That's where bad forecasts begin.
Next, standardize the core fields. Use MM/DD/YYYY for dates, put timestamps in one U.S. time zone, and store revenue in USD with the same separator style and the same treatment for taxes and discounts.
You also need enough history to model from. Use at least 12–24 months of standardized data at the grain you plan to forecast. Anything shorter can still point you in a direction, but it won't be precise.
After the records line up, choose the forecast grain based on the decision you need to make.
Choose the Right Forecast Grain Before Modeling
Pick the grain from the decision, not from whatever data happens to be sitting in your systems.
| Decision | Recommended Grain |
|---|---|
| Sales staffing and pipeline management | Weekly by segment |
| Cash flow planning and board reporting | Monthly by account group |
| New bookings and renewal planning | Quarterly |
Use the finest grain that still gives you 30–50 historical periods per segment. If weekly data is too thin, roll it up to monthly so the model doesn't overfit.
With clean data and the right grain in place, you're ready to build segments that behave differently enough to forecast on their own.
Step 2: Build Customer Segments Ready for Forecasting
Once your data is clean, the next move is to group customers based on the behaviors that shape demand. That matters because segments built around demand drivers give your model patterns it can actually learn from.
Pick Segmentation Variables Tied to Buying Behavior
Choose variables that help predict when customers buy and how large those deals tend to be. A good place to start is with industry, contract type, renewal cycle, deal size, order frequency, product mix, and payment behavior.
These variables can reveal repeat demand shifts in plain sight. Industry often connects to seasonality through NAICS codes. Contract type can affect booking timing. Renewal cycle can surface spikes around renewals. And late payments may hint at contraction or churn before revenue drops show up.
Keep the list short at first. Start with 2–3 main drivers, then add one more only if it clearly changes the demand pattern inside a group.
Use Clustering or Hybrid Rules to Create Stable Segments
Pick a method that fits both your data volume and your reporting needs. In practice, the right method depends on how much data you have and how easy the team needs the output to be to explain.
| Method | When to Use |
|---|---|
| Rule-based | Best for clear thresholds; easy to explain; needs manual updates. |
| Clustering | Best for richer data; finds hidden patterns; needs retraining. |
| Hybrid | Balances explainability and accuracy; more complex to maintain. |
A simple way to start: build a small set of rule-based segments first. Then test clusters inside those groups to see whether the data shows smaller patterns that deserve their own forecast.
Check That Each Segment Has Enough Data to Forecast
Small or unstable segments tend to drag down forecast accuracy. So don’t give a segment its own model unless it clears a few basic checks:
- Use 12–24 months of history at the chosen grain. Monthly is a practical starting point.
- Aim for 20–30 active customers per month and 5%–10% of annual revenue.
- Merge segments with noisy or random demand. A CV above 1.0 is a warning sign that a split may not hold up.
If a segment misses these checks, merge it with the closest neighboring group instead. Keep the total number of segments modest so each model has enough history to learn from.
With stable segments in place, the next step is training separate forecasts for each group.
Step 3: Train, Compare, and Use Segment-Level AI Forecasts
Next, pick the right model for each segment, compare it against a baseline, and plug the output into planning. Once your segments are stable, test different model families on the same backtest window.
Match Model Types to Segment Behavior
Pick models based on demand stability and how many factors drive the outcome. In most cases, the best move is the simplest model that still fits the segment’s buying pattern.
For stable recurring-revenue segments, classic time-series models such as ARIMA, exponential smoothing, or Prophet are often a good fit. They handle trend and seasonality well without needing many extra inputs.
For volatile or event-driven segments, you need a model that can work with several inputs at once. Gradient boosting models like XGBoost or LightGBM are much better suited for factors such as renewal timing, discount levels, marketing campaign touches, sales outreach frequency, and product usage metrics than a pure time-series model.
| Model Type | Best For | Interpretability |
|---|---|---|
| ARIMA / Exponential Smoothing | Stable, recurring segments with clear seasonality | High - parameters map to trend and seasonality |
| Prophet | Business series with holiday effects and mild volatility | High - trend, seasonality, and holiday components are visual |
| Gradient Boosting (XGBoost, LightGBM) | Volatile segments driven by sales, discounts, campaigns | Medium - feature importance is clear; individual predictions less so |
| Naive / Moving Average | Baseline comparison for any segment | Very high - trivial to explain |
Start with a model catalog for each segment. Write down demand volatility and the main drivers, then assign a primary model and a backup. Begin with simple baselines. Move to more complex models only if they improve accuracy in a way that matters.
Then test each model against your current forecast before you let it into the planning process.
Measure Forecast Accuracy Against a Baseline
Every AI forecast needs to beat the current method. Before calling a model useful, run it through a backtesting framework: train on the first 24 months of history, then test on the next 6–12 months. Use that same time window for both the AI model and your current spreadsheet or aggregate forecast. Also compare segment-level forecasts with the unsegmented company forecast.
Track four metrics for each segment: MAE, RMSE, MAPE, and bias. Each one tells you something a little different:
- MAE shows the average dollar error.
- RMSE puts more weight on big misses.
- MAPE shows percentage error.
- Bias shows whether you keep over-forecasting or under-forecasting.
For mature, stable segments, aim for MAPE under 10% to 15%. For newer or more volatile segments, under 20% to 25% is a fair target. If you see a 20% to 30% MAPE reduction plus lower bias versus baseline, that’s a meaningful gain. It should affect hiring plans, quota setting, and cash planning.
Use rolling-origin (walk-forward) backtesting instead of random cross-validation. Move the training window forward one period at a time, then average errors across at least 10 to 20 rolling points. That mirrors how forecasting works in practice and helps prevent future data from slipping into training.
Only models that beat the baseline should feed operating plans.
Feed Forecasts Into Weekly and Monthly Planning
Once a forecast has passed validation, put it to work in sales, finance, and workforce planning. Use segment forecasts in weekly sales planning, monthly finance updates, and quarterly headcount decisions.
Keep manual review in place for big forecast changes. Set firm thresholds. Any forecast shift above ±20% for a key segment, or any single deal above $250,000 ACV, should trigger a manual check. Record override decisions with a reason and an expiration date. Then watch whether those overrides help or hurt accuracy over time. If they keep helping, that usually means the model is missing an input or needs retraining.
Retraining cadence matters too. High-volume, campaign-driven segments may need monthly retraining. Stable, long-contract segments can often run on a quarterly or semiannual cycle. Retrain when forecast error starts climbing or bias drifts. If MAPE gets worse by 5 to 10 percentage points across several periods, or bias moves past ±10%, the model is no longer lined up with current customer behavior.
Conclusion: Turn Better Demand Forecasts Into Financial Decisions
AI can improve B2B demand forecasts when four things line up: clean data, behavior-based segments, segment-level models, and steady monitoring.
One academic study found that AI-based forecasting cut MAPE by 31.2%. For founders, the takeaway is straightforward: forecast accuracy only matters when it leads to better planning calls.
Key Takeaways for Startup Founders and Operators
A few points matter most here.
- Data quality is non-negotiable - weak historical data leads to forecast errors.
- Behavior-based segmentation - by ACV band, purchase frequency, industry, or product usage - helps match models to how customers buy.
- Model choice should follow segment behavior - stable recurring segments need a different setup than volatile, campaign-driven ones.
- Monitor and retrain - compare forecasts with actuals each week and retrain when error starts to climb.
A good place to start is simple: audit your source data, then define two or three high-value customer segments. In plain English, don't boil the ocean. Pick a small number of clear segments and get them right first.
Clean financial data is the last piece if you want forecasts leaders can trust. Lucid Financials can help keep your books clean and your financial inputs ready for forecasting.
FAQs
How do I know which customer segments to forecast separately?
Start with customer size and sales motion. Those two factors should line up with how deals move through your pipeline. If they don’t, your forecast will miss signals that matter.
From there, add factors like region or product type only if you have enough volume to support them. The goal is to segment where value or behavior clearly changes, not to slice the data for the sake of it.
Keep each category mutually exclusive. That way, every deal fits in one place, and your analysis stays clean and accurate.
What if I don’t have enough historical data for each segment?
You can still use AI for forecasting if you put data quality ahead of raw volume.
That means focusing on clean, consistent, standardized records like monthly recurring revenue and pipeline metrics. A smaller dataset that’s well organized will usually do more for your forecast than a giant pile of messy numbers.
If your data is thin, there are still ways to improve accuracy:
- Use synthetic data to fill gaps
- Apply transfer learning from similar industries
- Bring in external market indicators
The main idea is simple: unified, validated, error-free data is often more useful than a large, messy dataset.
When should I retrain an AI demand forecasting model?
Retrain your AI demand forecasting model when new data comes in or the market takes a sharp turn. As a starting point, update it at least once a month so it can keep up with data decay and new trends.
You should also retrain or recalibrate the model if forecast variance goes above 20% or you spot model drift. It also helps to run backtests every quarter against actual results, so the model stays accurate as your business grows.