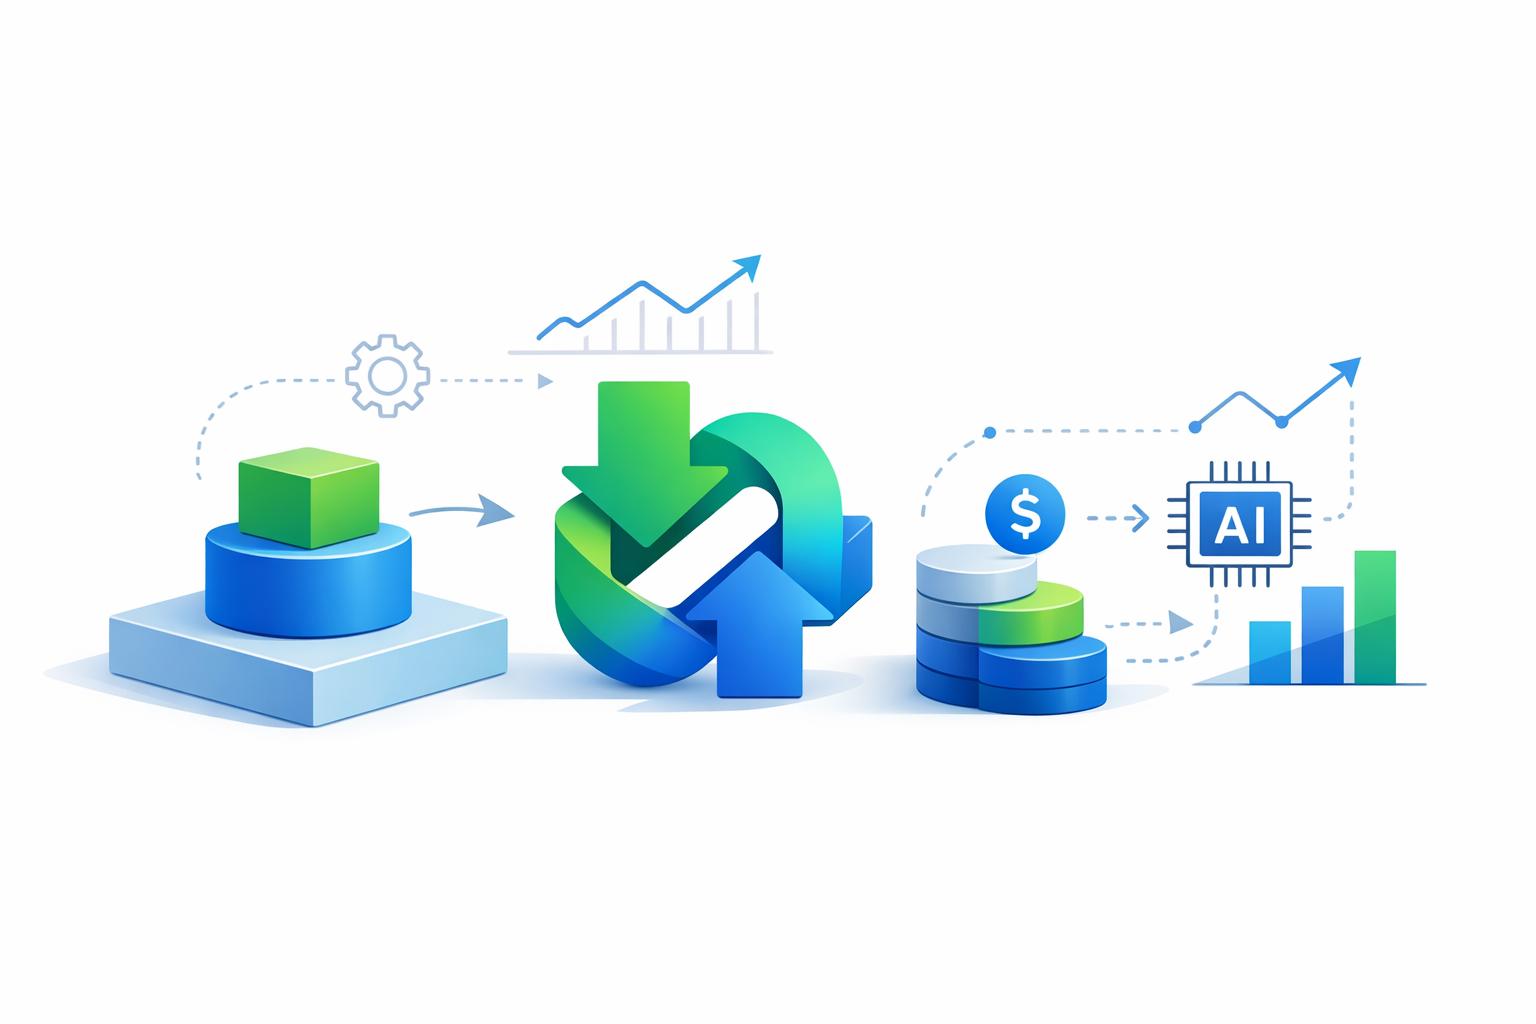
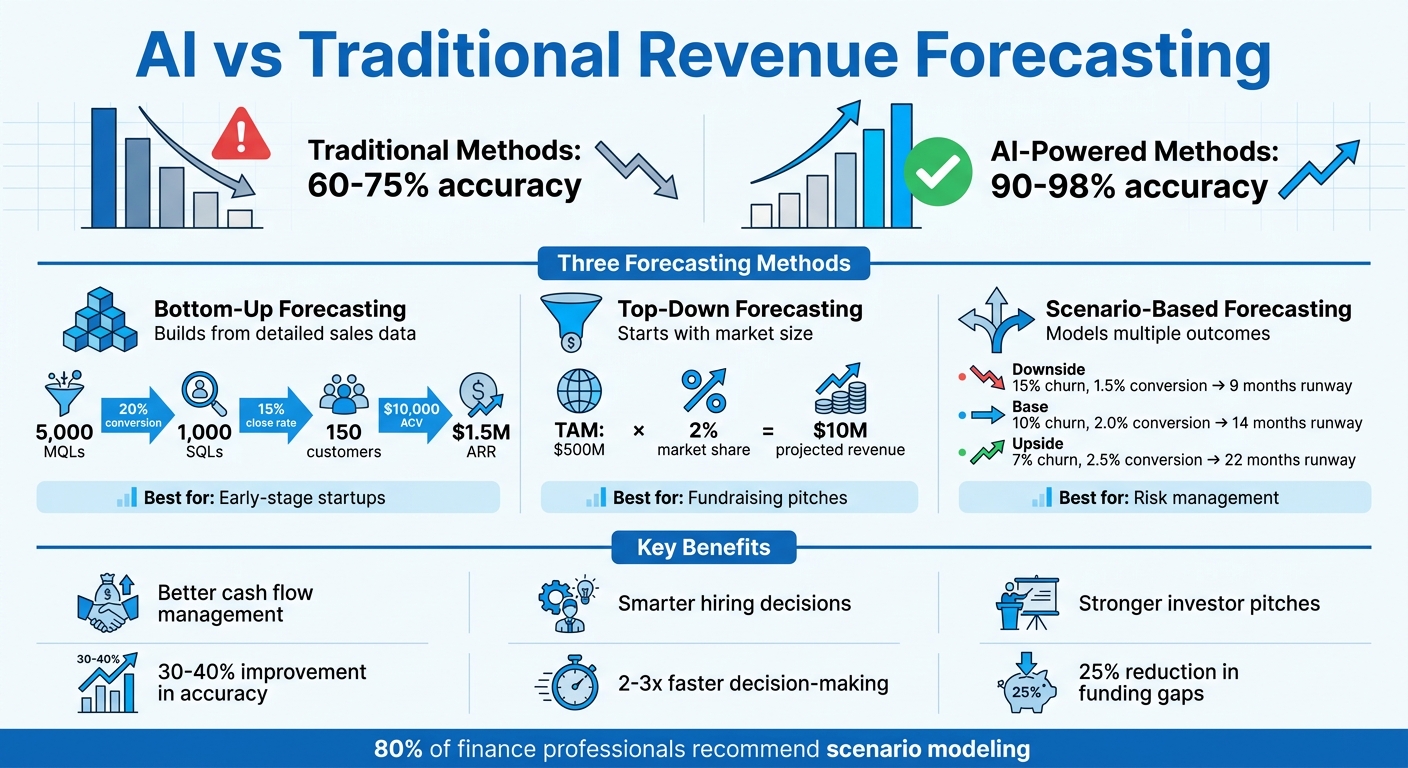
AI-powered revenue forecasting can transform how startups predict, plan, and grow. Traditional methods often lack accuracy (60–75%) and consume valuable time. AI, on the other hand, delivers predictions with 90–98% accuracy, saving time and reducing errors. For startups, this means better cash flow management, smarter hiring decisions, and stronger pitches to investors.
Key Takeaways:
- Why It Matters: Startups rely on accurate forecasts to manage cash flow, secure funding, and scale effectively.
- AI's Advantage: AI analyzes patterns beyond manual methods, offering up to 98% accuracy.
- Methods to Know:
- Bottom-Up: Builds forecasts from detailed sales data.
- Top-Down: Starts with market size and estimated share.
- Scenario-Based: Models best, base, and worst-case outcomes.
- Data Preparation: Clean, structured data is critical - focus on revenue, sales, acquisition, and churn metrics.
- Tools: Platforms like Lucid Financials automate forecasting, integrate with financial systems, and provide real-time insights for $150/month.
Bottom Line: AI forecasting isn’t just a tool - it’s a smarter way for startups to plan growth, avoid surprises, and make informed decisions.
AI vs Traditional Revenue Forecasting: Accuracy and Methods Comparison
The CFO’s Guide to Smarter Forecasting in Startups
sbb-itb-17e8ec9
3 Main Approaches to AI Revenue Forecasting
Choosing the right forecasting method is crucial for creating realistic revenue projections. The approach you select should align with your startup's stage, the data you have, and your overall business model. Below are three commonly used methods that can help you build solid AI revenue forecasts.
Bottom-Up Forecasting
Bottom-up forecasting starts with operational data like lead volume, conversion rates, sales cycles, and Average Contract Value (ACV). Instead of estimating broad figures, this method ties revenue projections to the actual performance of your sales funnel.
For example, a SaaS startup might generate 5,000 Marketing Qualified Leads (MQLs) per quarter. With a 20% conversion rate, that leads to 1,000 Sales Qualified Leads (SQLs). Applying a 15% close rate results in 150 new customers. Multiply those 150 customers by a $10,000 ACV, and you get a $1.5 million Annual Recurring Revenue (ARR) forecast. This approach is often favored by early-stage startups because it’s grounded in measurable sales data. Investors also appreciate bottom-up models because they demonstrate a clear understanding of how customers are acquired and retained.
The downside? You need clean historical data or reliable benchmarks to make the model work. Without these, the forecast can fall apart. Adding too many variables can also make the model overly complex and harder to manage.
Top-Down Forecasting
Top-down forecasting begins with your Total Addressable Market (TAM) and applies an estimated market share to calculate potential revenue. For instance, if your TAM is $500 million and you believe you can capture 2% of it, your revenue projection would be $10 million.
This approach is helpful for startups without historical data, as it provides a high-level view of market potential - especially useful during fundraising. However, it’s often criticized for leading to overly optimistic "hockey stick" projections that lack operational credibility. As one Growth Equity Managing Partner noted:
"The fastest way to lose my trust as an investor is to show me a forecast where the numbers are completely detached from the operational reality of how you acquire and serve customers."
Top-down forecasting is best used for setting a vision or pitching to investors. It’s less effective for detailed operational planning because of its broad and often overly optimistic nature.
Scenario-Based Forecasting
Scenario-based forecasting involves creating multiple models - like a Base Case, an Upside Case, and a Downside Case - by tweaking key assumptions such as churn rate, sales conversion rates, or customer acquisition costs. For example, a SaaS company might build these scenarios:
- Downside: 15% annual churn, 1.5% sales conversion rate (9 months of cash runway)
- Base: 10% churn, 2.0% conversion rate (14 months runway)
- Upside: 7% churn, 2.5% conversion rate (22 months runway)
This method is especially valuable for managing risks and preparing for uncertainties. It’s widely used by B2B SaaS and product-led growth companies dealing with pipeline fluctuations or usage-based revenue swings. In fact, 80% of finance professionals recommend scenario modeling for its flexibility in adapting to real-time changes.
The main challenge lies in managing the complexity of spreadsheets as variables increase. Identifying the most sensitive inputs is key to keeping the model manageable. Still, the benefits are clear - startups that fail to base their forecasts on reconciled data are three times more likely to face cash flow crises within 18 months.
Up next, focus on preparing your data for accurate AI-driven forecasting.
Preparing Your Data for AI Forecasting
AI forecasting is only as reliable as the data you provide. Clean, well-structured data is essential for accurate revenue predictions. Without it, even the most advanced AI models can produce inconsistent or misleading results. As Copy.ai emphasizes:
"A forecast built on dirty data will always produce unreliable results, no matter how advanced the model".
Currently, fewer than half of sales leaders feel confident in the accuracy of their forecasts. This lack of trust often stems from fragmented data spread across CRMs, billing systems, and spreadsheets, combined with inconsistent data management practices. Before leveraging AI for forecasting, it’s crucial to gather the right data and ensure it’s both accurate and complete. The next step is identifying which specific data points your AI model needs.
What Data You Need to Collect
To power your AI forecasting model, focus on four main categories of data.
- Historical revenue data: This includes Monthly Recurring Revenue (MRR), Annual Recurring Revenue (ARR), and past bookings, which help establish a baseline for projections.
- Pipeline and sales metrics: Track deal stages, close dates, deal values, win probabilities, and the average length of your sales cycle.
- Customer acquisition metrics: Monitor lead volume by source, conversion rates (lead-to-opportunity and opportunity-to-close), and Cost Per Lead (CPL).
- Retention and churn data: Gather monthly churn rates, renewal rates, expansion revenue, and customer health scores.
Don’t overlook qualitative inputs. Modern AI tools can analyze sales transcripts and emails to detect sentiment and engagement gaps. Additionally, documenting your Ideal Customer Profile (ICP) and defining your addressable market subset will help ground your lead generation assumptions.
| Data Category | Specific Data Points to Collect |
|---|---|
| Sales | ACV/ARPU, Sales cycle length, Win rates, Deal stages |
| Marketing | Lead volume by source, Cost Per Lead (CPL), Conversion rates |
| Customer Success | Monthly churn rate, Renewal rate, Expansion/Upsell revenue |
| Finance | Historical MRR/ARR, Seasonal patterns, Budget actuals |
Cleaning and Organizing Your Data
Once you’ve gathered the necessary data, the next step is to address common issues like incomplete records, duplicate entries, and inconsistent categorization. These problems can significantly impact the accuracy of your forecasts. For example, missing close dates or deal values, duplicate entries inflating your pipeline, or miscategorized deals can all distort projections. Even a small monthly churn rate error can cause revenue overestimations in months 6–12 of a forecast.
To maintain data integrity, standardize data entry across your team. Frameworks like MEDDIC or BANT can help ensure uniform definitions for pipeline stages. Regularly update deal values and close dates with consistent detail. Additionally, integrate your data systems - connecting sales data from your CRM, marketing metrics from analytics platforms, and customer success data into a unified, continuously updated stream. This reduces manual reconciliation and minimizes delays between sales activity and financial reporting.
Clearly label each data input (e.g., "Conversion rate: 12% over 6 months") to validate assumptions. It’s also vital to differentiate between revenue and cash flow. While forecasts should reflect when deals close, runway calculations depend on when cash is actually received. Companies that successfully implement AI for forecasting report spending 16% more time on strategic activities rather than manual data processing - provided their data is trustworthy.
How to Implement AI Revenue Forecasting
Once your data is cleaned and organized, you're ready to dive into building an AI-driven revenue forecast. This process transforms raw numbers into actionable revenue predictions. It involves three main steps: setting up inputs, generating forecasts, and validating the results. Each step is crucial for creating a reliable forecasting system.
Setting Up Your Forecast Inputs
First, identify all your revenue streams - whether it's subscription income, one-time sales, licensing fees, or additional sources. Gather 12–24 months of monthly data for each revenue stream to capture trends and seasonal patterns.
It's equally important to clearly document your assumptions. For example, you might note, "We anticipate 20 new enterprise customers each month, with each contract valued at $50,000 and a 90-day sales cycle." This level of clarity matters - Deloitte's 2024 AI in Finance Survey found that 85% of finance leaders using AI make better decisions when assumptions are well-documented.
If you're using no-code platforms, simply upload your clean CSV data, set revenue as the target variable, and let the platform create a model for you in minutes. For those with technical expertise, open-source tools like Facebook Prophet (popular with over 20,000 GitHub stars) allow for more customization. When splitting your historical data for model training, allocate 80% for training and 20% for testing to ensure accuracy.
Generating and Checking Your Forecasts
Run your model to generate forecasts for the next 12–24 months. The output will include monthly revenue projections along with confidence intervals, offering both a baseline figure and a range of possible outcomes. For example, your forecast might show a revenue range of $500,000–$750,000 for month 12.
To validate your forecasts, use holdout data and aim for a MAPE (Mean Absolute Percentage Error) below 10% for accuracy. If the error rate exceeds 20%, revisit your data and assumptions to identify possible issues.
Backtesting is another essential step. This involves using the AI model to predict past performance and comparing it to actual historical data. If the model struggles to recreate accurate historical forecasts, it’s unlikely to predict future trends reliably. Refine your inputs until the historical forecasts closely match actual results.
For startups looking for an all-in-one solution, tools like Lucid Financials simplify the entire process.
Using Lucid Financials for AI Forecasting
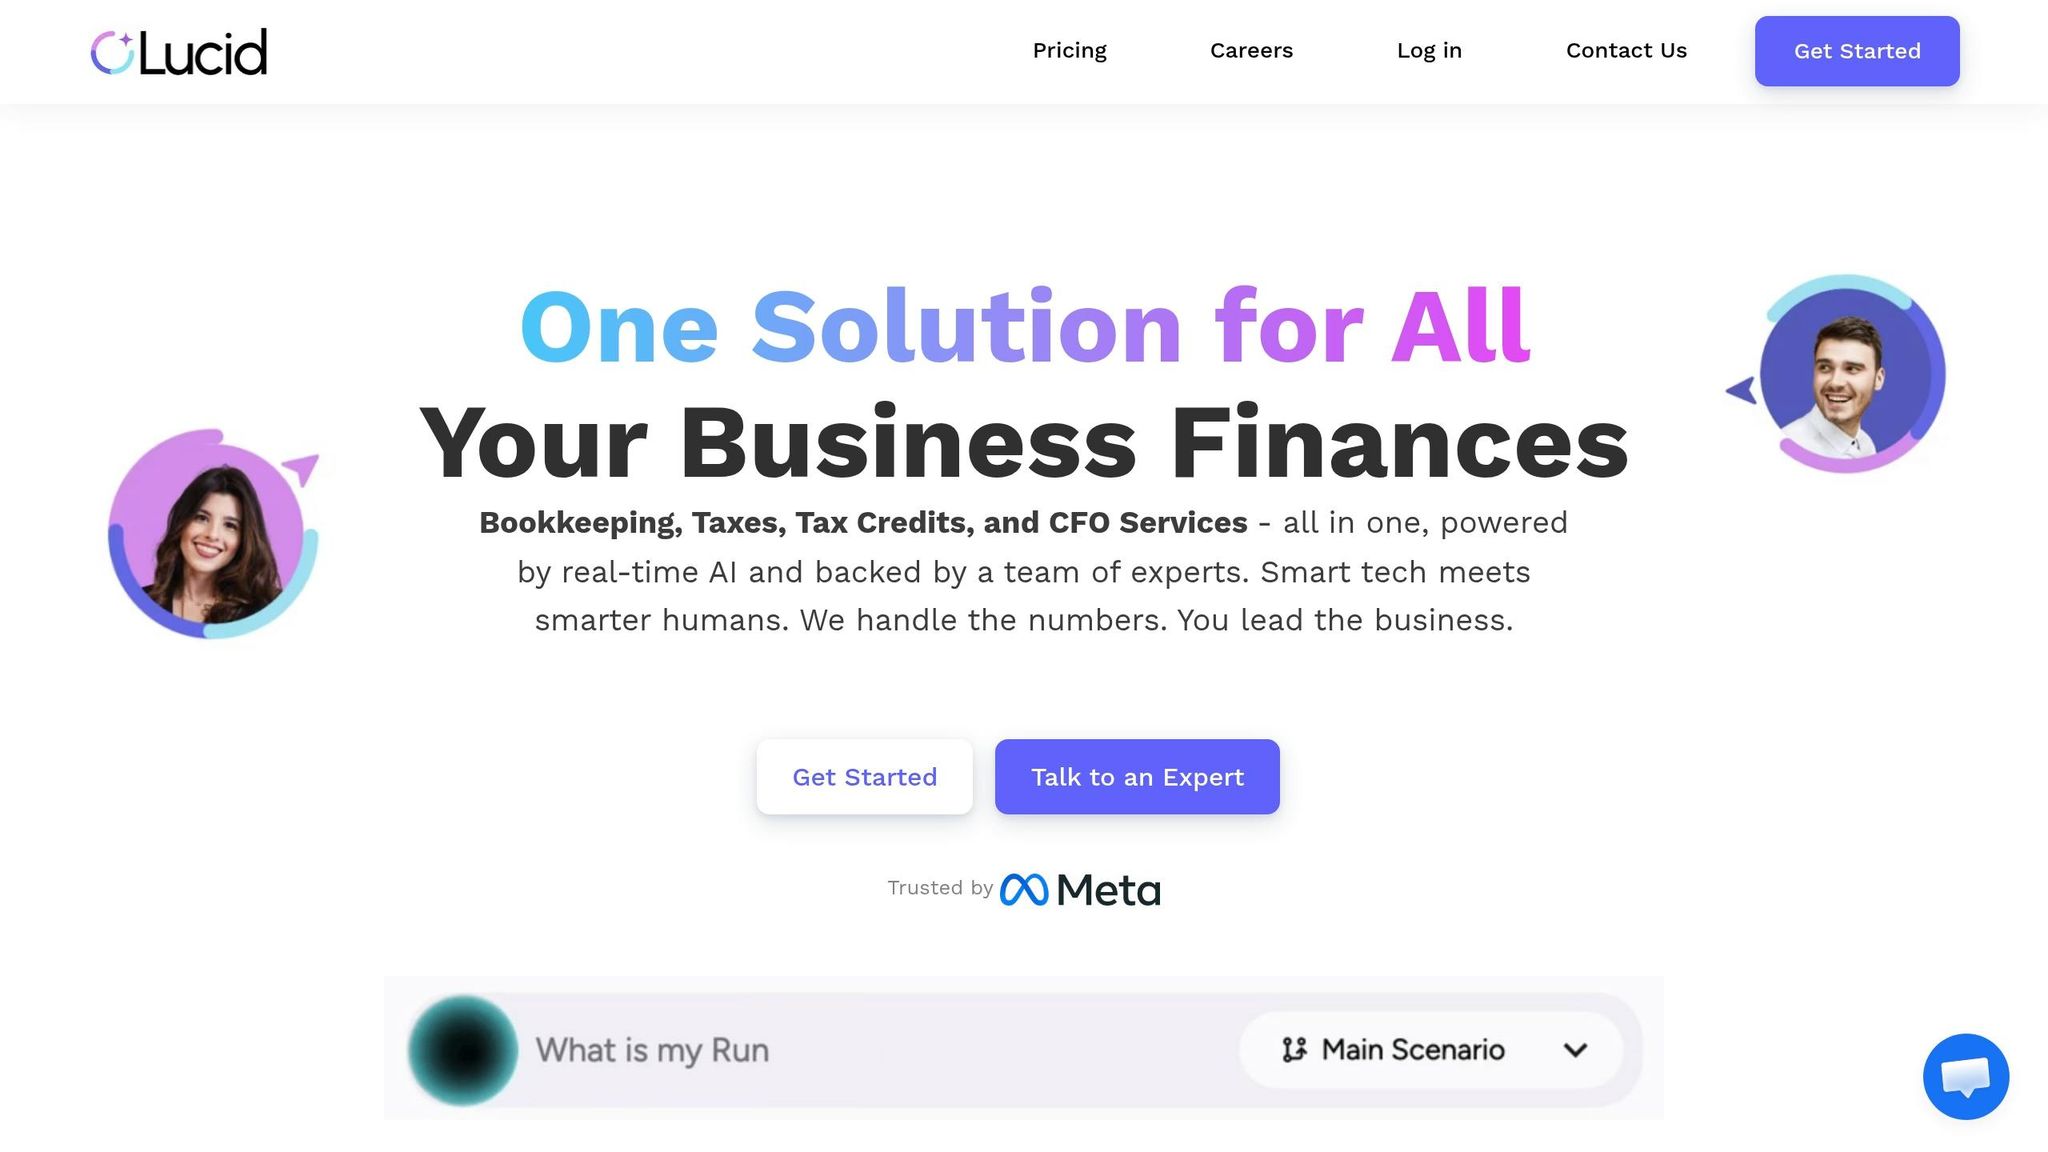
Lucid Financials makes AI forecasting seamless by connecting directly with your financial systems, including bank accounts, Stripe, PayPal, and QuickBooks. This real-time integration eliminates the need for manual data uploads, ensuring forecasts are always based on the most up-to-date performance data.
With its Slack integration, you can ask questions like, "What’s our projected runway?" or "How does our Q2 forecast compare to actuals?" and instantly receive AI-generated answers backed by live financial data. Lucid also creates financial plans that include best-case, worst-case, and actual scenarios, and it can generate board-ready reports with just one click. This feature has been a hit with VCs, as it provides real-time forecasting updates during meetings.
Lucid goes further by offering CFO-level services. It tracks your burn rate and runway in real time, flagging any deviations from your forecasted performance. This constant validation ensures your projections stay accurate as business conditions shift. Starting at $150 per month, Lucid combines bookkeeping, tax services, and AI forecasting into one platform. It delivers clean financial records within seven days and provides always-on, investor-ready reporting.
Using AI for Scenario Planning
Pairing AI with revenue forecasting takes scenario planning to a whole new level. By modeling multiple potential outcomes, AI helps businesses make informed decisions. Unlike traditional manual spreadsheet methods, AI can generate countless scenarios in seconds, cutting modeling time by up to 90% and removing much of the tedious guesswork involved.
Creating Best-Case, Base-Case, and Worst-Case Scenarios
Scenario planning typically revolves around three key models: best-case (optimistic growth), base-case (realistic expectations), and worst-case (pessimistic downturn). For each scenario, you’ll need to adjust variables like customer acquisition rates, churn percentages, average contract values, and sales cycle lengths. AI platforms handle these changes instantly, recalculating critical metrics like revenue projections, burn rate, and financial runway.
The real game-changer? AI continuously updates these scenarios as new data flows in. With accuracy levels of 85–95% compared to the 60–70% achieved through manual methods, AI forecasting significantly reduces risks. For instance, it can lower the chances of running out of cash by up to 40%.
Sensitivity testing is another key feature - small tweaks to variables can lead to noticeable differences in outcomes. AI even provides automated alerts, giving you a heads-up 3–6 weeks in advance if actual performance starts to deviate from your base-case scenario. These dynamic models become a reliable foundation for testing critical strategies.
Testing Business Decisions with AI
Once your scenarios are built, AI becomes a powerful tool for evaluating strategic decisions. Whether you’re considering expanding your team or adjusting your pricing model, AI can simulate the financial impact of these choices. It helps you understand how decisions will affect cash flow, profitability, and overall performance before you commit resources.
AI analyst tools make this process even more accessible. You can ask straightforward questions like, “What happens to our runway if we increase marketing spend?” or “How will launching a new product affect our cash position?” The AI uses historical data and real-time inputs to provide detailed simulations. For example, AI-driven pricing adjustments alone can increase revenue by 2–5%.
"Our AI generates and compares scenarios, helping you choose the right path." - Lucid
This approach turns decision-making into a data-driven process. By identifying the most effective operational changes, AI helps you focus on strategies that drive growth and improve outcomes.
Keeping Your Forecasts Accurate Over Time
A revenue forecast is not a one-and-done task. If left untouched, it quickly becomes irrelevant as your startup evolves and market dynamics shift. Your AI models need regular updates to stay dependable. In fact, nearly 93% of sales leaders struggle to forecast revenue within a 5% margin, even with only two weeks left in the quarter. To keep your forecasts reliable, you’ll need to continuously evaluate accuracy, incorporate fresh data, and document what you learn along the way.
Measuring Forecast Accuracy
AI can deliver precise forecasts, but its true value comes from regular performance checks. To ensure reliability, measure the gap between predictions and actual results using metrics like forecast variance and Mean Absolute Percentage Error (MAPE). Top-performing organizations aim for a variance of less than 5%, while most fall between 10% and 15%. If your variance exceeds 20%, it could point to deeper structural problems. MAPE is particularly useful for spotting trends, such as whether forecasts falter during specific quarters or after major business changes.
When actual outcomes deviate from predictions, dig into the reasons behind the mismatch. For example, is your sales cycle taking longer? Are churn rates climbing? Are conversion rates shifting? Document these findings and refine your assumptions accordingly.
Updating Your Models with New Data
To keep forecasts relevant, update them monthly with the latest data. Here’s why: B2B contact data, for instance, decays at a rate of 2.1% per month. Over the course of a year, up to 70% of your database could become unreliable. Without fresh data, you risk making decisions based on outdated information.
Set up real-time data pipelines to automatically pull in updates from your CRM, customer engagement metrics, and market indicators. This ensures your models reflect current conditions. Additionally, keep an eye on model drift - when market changes render your assumptions less accurate - and adjust as needed. The goal isn’t perfection but creating a system that adapts and improves over time.
Recording Insights for Better Forecasts
Every forecasting error is a chance to learn. For example, if you overestimated conversion rates or underestimated how long customers take to pay, document these insights. Flag any unvalidated inputs as “guesses” so you know what to prioritize for future refinement. This feedback loop turns misses into opportunities for improvement.
"A forecast built in January and never touched is a historical document. Update it every month with actuals." - DimeADozen.ai
Simplicity is key. The best forecasts rely on clear, observable metrics like leads, conversion rates, and sales cycle lengths - not overly complicated formulas. By keeping your models straightforward and documenting your insights, you transform forecasting into an effective management tool rather than just a planning exercise.
Wrapping Up
AI-powered revenue forecasting transforms how businesses make decisions, manage cash flow, and scale effectively. By analyzing vast datasets and market trends with over 90% accuracy, it enables more confident hiring, better cash flow management, and investor-ready projections that can unlock funding opportunities.
Startups using AI forecasting tools report a 30–40% improvement in revenue prediction accuracy. They also experience decision-making cycles that are 2–3 times faster. Additionally, 78% of startups leveraging AI in their financial processes achieve smoother cash flow management and reduce funding gaps by 25%.
To take your forecasting to the next level, consider streamlining your financial processes. Lucid Financials offers a comprehensive solution that combines AI forecasting, bookkeeping, tax services, and CFO support - all accessible via Slack. By eliminating time-consuming manual tasks, Lucid Financials helps founders focus on growth. Its real-time integrations ensure that clean data preparation translates into actionable insights. With their service, you can expect clean books in just seven days, instant answers to financial questions, and investor-ready reports. As Aviv Farhi, CEO of Showcase, shares:
"Lucid turned our bookkeeping and taxes from a headache into a simple, reliable process. Their CFO insights give us clarity to plan growth with confidence - it feels like having a full finance team on demand."
The process is simple: start with clean historical data, test your forecasting models against actual results, and update them monthly as your business evolves. For just $150/month, Lucid Financials takes care of the heavy lifting, allowing you to focus on scaling your startup with precise, actionable financial insights. Keep your forecasts accurate and your business on track for steady growth with Lucid Financials.
FAQs
How much historical data is needed for AI revenue forecasting?
To start using AI for revenue forecasting, you'll need at least 12 months of clean, standardized historical data. This allows the AI to analyze patterns effectively and deliver accurate predictions.
What’s the best way to forecast if my startup has little or messy data?
Before diving into AI forecasting tools, it's crucial to clean and standardize your data. AI models thrive on consistent, high-quality information - ideally, you should have at least 12 months' worth of data from systems like billing platforms, CRMs, or analytics tools. This gives the models a solid base to spot trends and patterns effectively.
One advantage of AI techniques like machine learning is their ability to work with messy or incomplete datasets better than traditional methods. However, using tools that automate data cleaning can still make a huge difference. These tools not only save you time but also help reduce errors, ensuring your decisions are based on more reliable insights.
How often should I update my AI forecast to stay accurate?
Keep your AI forecast up to date by reviewing and updating it regularly - aim for at least once a month or whenever major new data becomes available. Staying current ensures your insights reflect the latest market trends, enabling you to make smarter financial decisions.