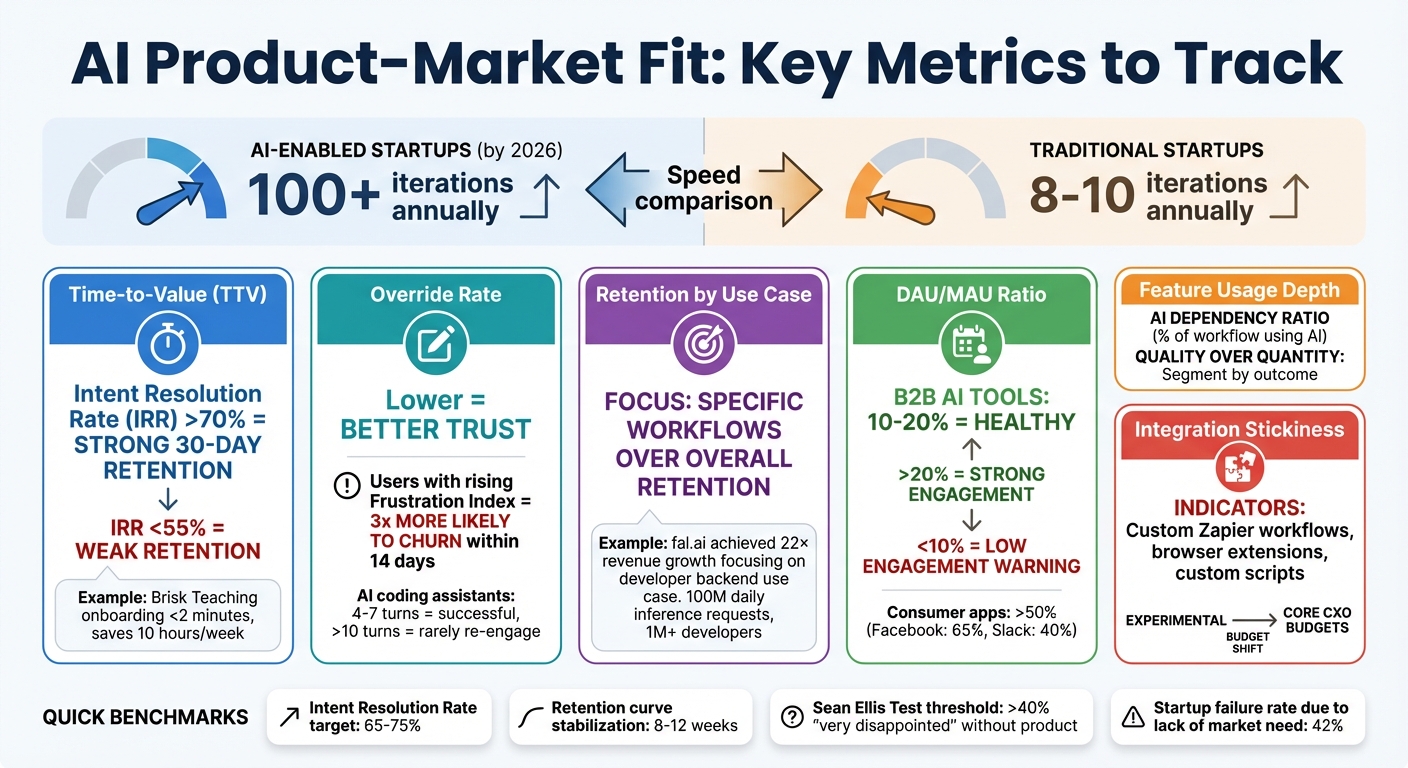
AI is reshaping how startups achieve product-market fit (PMF). By 2026, AI tools enable startups to iterate faster - completing over 100 iterations annually compared to the traditional 8–10. This speed allows companies to quickly adapt to user needs but also raises user expectations. Tracking the right metrics is critical to success. Here’s what matters most:
- Time-to-Value (TTV): How quickly users experience benefits. Faster TTV improves retention. Metrics like Intent Resolution Rate (IRR) and "Second-Bite" usage help measure this.
- Override Rate: Tracks user trust in AI outputs. A lower override rate signals better alignment with user needs.
- Retention by Use Case: Focus on specific workflows where your product becomes indispensable, rather than overall retention.
- Engagement Metrics (DAU/MAU): Measure user stickiness to identify habitual use.
- Feature Usage Depth: Understand how deeply users interact with your core features.
- Integration and Workflow Stickiness: Look for signs your product is embedded into users’ daily operations, such as custom integrations or team-wide adoption.
AI tools also excel in analyzing real-time data, uncovering hidden pain points, and predicting patterns that drive retention. By focusing on these metrics, startups can transform PMF from a one-time milestone into an ongoing, measurable process.
Key AI Product-Market Fit Metrics and Benchmarks for Startups
How to Achieve AI Product-Market Fit and Drive ROI?
sbb-itb-17e8ec9
Core Metrics to Track for Product-Market Fit
When evaluating product-market fit, it’s important to focus on metrics that reflect genuine user value rather than surface-level numbers. These metrics help turn product-market fit into something measurable and actionable.
Time-to-Value
Time-to-Value (TTV) measures how quickly users experience the core benefits of your product. In today’s fast-paced environment, where switching costs are low, users expect immediate value. If they don’t see results quickly, they’re likely to churn. Kim Caldbeck, Operating Advisor, puts it simply:
"The AI tools that will win their markets will be very plug-and-play to show value".
The best AI products deliver results almost instantly - sometimes during a live demo or within the first 24 hours. For example, Brisk Teaching, an AI-powered Chrome extension, reached over 1 million educators across 100+ countries by March 2025. By integrating directly into tools like Google Docs, it reduced teacher onboarding to under two minutes and saved educators over 10 hours per week on administrative tasks. This seamless experience ensured users saw value before they even considered alternatives.
To measure TTV effectively, track metrics like the Intent Resolution Rate (IRR) - the percentage of user intents resolved without needing clarification. Products with an IRR above 70% tend to have much stronger 30-day retention compared to those below 55%. Another key indicator is "Second-Bite" usage, which measures whether users return for similar interactions after their first successful experience.
Klarna provides a great example of optimizing TTV at scale. In December 2025, the company launched an AI assistant that reduced customer inquiry resolution time from 11 minutes (human-led) to under 2 minutes. This system now handles 2.3 million conversations monthly - the workload of 700 full-time agents - delivering immediate value to customers.
Override Rate
Once users experience quick value, the next step is to ensure they trust the product. Override Rate measures how often users override or correct AI outputs. A declining override rate signals that the AI is improving and user trust is growing. On the flip side, a high or increasing override rate can indicate misalignment between the AI’s outputs and user expectations - often before retention metrics begin to drop.
AI systems can monitor override patterns by analyzing conversation logs for signs like repeated queries, follow-ups pointing out misunderstandings, or session abandonment. These patterns contribute to a "Frustration Index", a composite metric that predicts churn risk. Users whose Frustration Index rises over two consecutive sessions are three times more likely to churn within 14 days.
It’s also important to segment conversation depth by outcomes. For instance, a 12-turn conversation might mean the AI successfully resolved a complex issue - or it might reflect user frustration due to repeated misunderstandings. In AI coding assistants, interactions averaging 4–7 turns are typically successful, while sessions exceeding 10 turns rarely lead to re-engagement within a week.
Adam Fisher, Partner at Bessemer Venture Partners, highlights the stakes:
"If they're reverting to manual processes, the AI value isn't sticking".
By keeping an eye on override patterns, companies can detect potential quality issues weeks before they affect churn, allowing time for proactive fixes.
Retention by Use Case
Overall retention can be misleading, especially for AI products, as it might reflect initial curiosity or experimental use rather than true adoption. Retention by Use Case digs deeper by analyzing retention rates for specific workflows or tasks, helping identify where your product becomes essential. High retention in a key use case is a stronger indicator of product-market fit than moderate overall retention.
For AI products, the "activation moment" often occurs during a specific interaction, like a conversation pattern or intent, rather than through general engagement metrics like pageviews. Studying the behaviors of users retained for 90+ days can reveal which early interactions were pivotal. For example, in AI tutoring, users who engage in a "concept exploration" conversation (lasting 6+ turns) within their first three days are three times more likely to stay compared to those who only ask factual questions.
fal.ai illustrates this well. By focusing on the "developer backend" use case, the generative media platform achieved 22× revenue growth in a single year, ending in late 2025. Offering fast APIs, fal.ai now processes 100 million daily inference requests for over 1 million developers, including teams at Canva and Perplexity. Instead of chasing broad adoption, they zeroed in on a specific, high-retention workflow.
Similarly, Vapi, a voice AI platform, pivoted to a developer-first model during its Y Combinator cohort. By targeting high-retention use cases like healthcare and customer service voice agents, Vapi reached millions in revenue within six months, supporting millions of calls monthly. Focusing on specific, indispensable use cases allowed these companies to create lasting value for their users.
Measuring User Engagement and Adoption
Once you've tracked how quickly users find value and whether they trust your AI's outputs, the next step is understanding how deeply they integrate your product into their daily lives. Engagement metrics help distinguish casual experimentation from committed, habitual use.
Active User Metrics (DAU/WAU/MAU)
The DAU/MAU ratio - daily active users divided by monthly active users - is often referred to as a "stickiness" metric. It shows how many of your monthly users interact with your product daily, offering a clear view of habitual versus occasional use.
For B2B AI tools, a healthy DAU/MAU ratio typically falls between 10% and 20%. Ratios above 20% indicate strong engagement, while consumer apps that become part of users' daily routines, like messaging platforms, often see ratios exceeding 50%. For example, Facebook has historically maintained a ratio around 65%, and Slack averages about 40% for active teams.
These benchmarks help set realistic engagement goals. A ratio below 10% signals low engagement, suggesting users aren't finding enough value to return regularly. If you find your product in this range, it may be time to revisit your Time-to-Value metrics or identify friction points that discourage users from coming back.
It's also important to avoid getting misled by early spikes in activity. These "honeymoon phase" numbers often reflect initial curiosity rather than sustained need. Waiting until Month 3 or Month 6 provides a clearer picture of durable engagement. If your retention curve stabilizes between 8 and 12 weeks instead of dropping off, it's a strong sign that users are moving from casual testing to long-term adoption. Once daily engagement is established, diving deeper into feature interaction metrics can provide even more insight.
Feature Usage Depth
While stickiness metrics show how often users return, feature usage depth highlights the quality of their interactions. Are users engaging with your product's core features, or are they just scratching the surface? This metric provides crucial insight into how well your product meets user needs.
For AI tools, traditional depth metrics like session length can sometimes be misleading. A long session might indicate deep engagement - or it could signal frustration if the user is stuck in a loop with an unhelpful model. To make sense of this data, segment interactions by outcome. For instance, long sessions that end in resolution show genuine engagement, while those ending in abandonment point to user dissatisfaction.
Identifying "activation conversations" can also be revealing. These are specific interaction patterns that strongly predict long-term retention. For example, with AI coding assistants, successful sessions often average 4 to 7 turns, while sessions exceeding 10 turns rarely lead to re-engagement within a week.
Another valuable metric is the AI Dependency Ratio, which measures the percentage of a user's workflow that now involves your AI tool. A rising dependency ratio indicates that users are shifting from trial to essential use. When users start integrating your AI into multiple parts of their workflow, it signals that your product has become a critical part of their routine.
Together, these metrics paint a comprehensive picture of how deeply and consistently your AI product aligns with user needs and expectations.
Integration and Workflow Stickiness
After evaluating core usage metrics, the next step in determining product-market fit is understanding how seamlessly your tool integrates into users’ daily workflows. The ultimate sign of success? When users can’t imagine working without it - when your tool becomes a fundamental part of their operations rather than just an occasional experiment.
Integration with Other Tools
A clear sign of workflow stickiness is when users start building integrations around your product. If people are creating Zapier workflows, browser extensions, or custom scripts to connect your tool with their existing tech stack, it’s a strong indicator that your product has become indispensable. These user-driven integrations show that your tool isn’t just another app - it’s a critical piece of their daily operations.
Take Linear, for example. Between 2020 and 2022, engineering teams at fast-growing startups began switching from Jira to Linear, often without prompting. This shift happened despite the significant challenges involved, such as years of accumulated data and well-established habits. Why? Linear’s faster performance and workflow-friendly design aligned more effectively with modern developer needs. When users willingly overcome such barriers, it’s a clear sign that your product has become a necessity.
The goal is to minimize context-switching. Products that integrate directly into existing workflows - allowing users to stay within their familiar environments - remove friction and naturally become essential.
User Feedback on Workflow Dependence
While engagement metrics offer a quantitative view, user feedback provides a deeper, qualitative understanding of your tool’s role in daily operations. It’s one thing to track real-time financial insights; it’s another to hear users describe how central your tool has become.
During user interviews, ask questions like, “Where does this fit in your tech stack?”. Their answers will reveal whether your product is viewed as a core tool or just a peripheral experiment. Behavioral cues are also telling. For instance, when users start turning your product name into a verb - like saying, “Just Slack me” - it’s a sign of deep integration. Additionally, watching your tool move from single-user pilots to widespread organizational adoption is another indicator of its indispensability. When a product becomes essential, it often spreads organically as team members share it with others.
"Increasingly, we're seeing people really shift away from just experimental AI budgets to core office of the CXO budgets. Digging into that is super critical to ensure that this is a tool, a solution, a platform that's here to stay."
– Murali Joshi, Partner, Iconiq
This shift in budget allocation - from experimental to essential - highlights a critical milestone. It signals that your AI tool has gone from being a "nice-to-have" to something users simply can’t operate without.
Key Takeaways and Next Steps
Measuring product-market fit for AI products requires a fresh approach compared to traditional software. The key metrics to focus on include:
- Intent Resolution Rate (IRR): Aim for a range of 65–75%. Products hitting an IRR above 70% tend to show much stronger 30-day retention compared to those below 55%.
- Retention by specific use case: Look beyond overall retention and drill down into retention for distinct use cases.
- Frustration Index: Keep an eye out for red flags like repeated user actions or session abandonment.
These AI-specific metrics are crucial for determining if your product is solving real problems or simply offering a fleeting novelty.
A good starting point is identifying your activation conversation - the interaction pattern that most strongly predicts long-term retention. Precise user segmentation is equally important, as average metrics often obscure critical insights. For inspiration, revisit the Superhuman case study mentioned earlier, which highlights how effective segmentation led to strong product-market fit.
To turn these metrics into actionable insights, establish a regular review process. Check engagement metrics weekly, analyze retention cohorts monthly, and conduct a full product-market fit assessment every quarter. Use tools like the Sean Ellis Test to measure emotional attachment. If fewer than 40% of users say they’d be "very disappointed" without your product, you haven’t yet achieved a solid fit. Additionally, track how users "pay" you through a progression of currencies: attention, time, reputation, commitment, and eventually money. True validation happens when users are willing to pay monetarily.
While product metrics are essential, financial health is just as critical. Aligning product success with financial clarity ensures sustainable growth. For example, Lucid Financials offers AI-powered bookkeeping and CFO services that integrate seamlessly with Slack, providing real-time insights and investor-ready reports within seven days. With 42% of startups failing due to a lack of market need, having accurate financial data alongside your product metrics is key to making smarter investment decisions.
FAQs
How do I measure Time-to-Value for my AI product?
To gauge Time-to-Value (TTV) for your AI product, focus on how quickly users accomplish the outcomes they’re aiming for after starting to use your product. Begin by clearly identifying the specific value your users are looking for. Then, measure the time it takes from their first interaction with the product to when they hit significant milestones that reflect that value. Regularly review this data to pinpoint any bottlenecks or delays. By addressing these issues, you can refine workflows, better meet user needs, and speed up adoption.
What’s a good Override Rate, and how do I lower it?
A good Override Rate varies depending on the situation, but in general, a lower rate indicates stronger AI performance. While there isn’t a universal benchmark, aiming for related metrics like a burn multiple under 2x and a CAC-to-LTV ratio of 4:1 or better can serve as helpful guidelines.
To bring the Override Rate down, focus on improving AI accuracy. This can be achieved by refining models through user feedback and reducing the need for human intervention. The key is ensuring the AI has a better grasp of user intent.
How do I find my product’s “activation conversation”?
To figure out your product’s “activation conversation,” zero in on the moments when users engage and start seeing value. This often involves analyzing key interactions that indicate early satisfaction and potential long-term retention. You can dive deeper by conducting customer interviews or studying user conversations to identify the actions that matter most. Metrics like intent resolution or meaningful engagement can spotlight these pivotal moments, helping you validate whether your product truly resonates with your audience.