AI-driven behavioral pattern recognition helps businesses analyze recurring investor behaviors like herding, panic selling, and sentiment shifts. By leveraging data from prices, trading volumes, news sentiment, and macroeconomic indicators, startups can make informed financial decisions. This technology improves risk management, fundraising timing, and liquidity planning.
Key steps include:
- Defining use cases: Focus on behaviors like sentiment shifts, trading anomalies, and liquidity stress.
- Mapping patterns to decisions: Link behavioral insights to actions like capital allocation or liquidity management.
- Building infrastructure: Use scalable data storage, real-time pipelines, and secure systems.
- Deploying AI models: Apply techniques like CNNs or LSTMs for pattern detection and refine features for accuracy.
- Validating models: Backtest with historical data, monitor performance, and stress test under extreme scenarios.
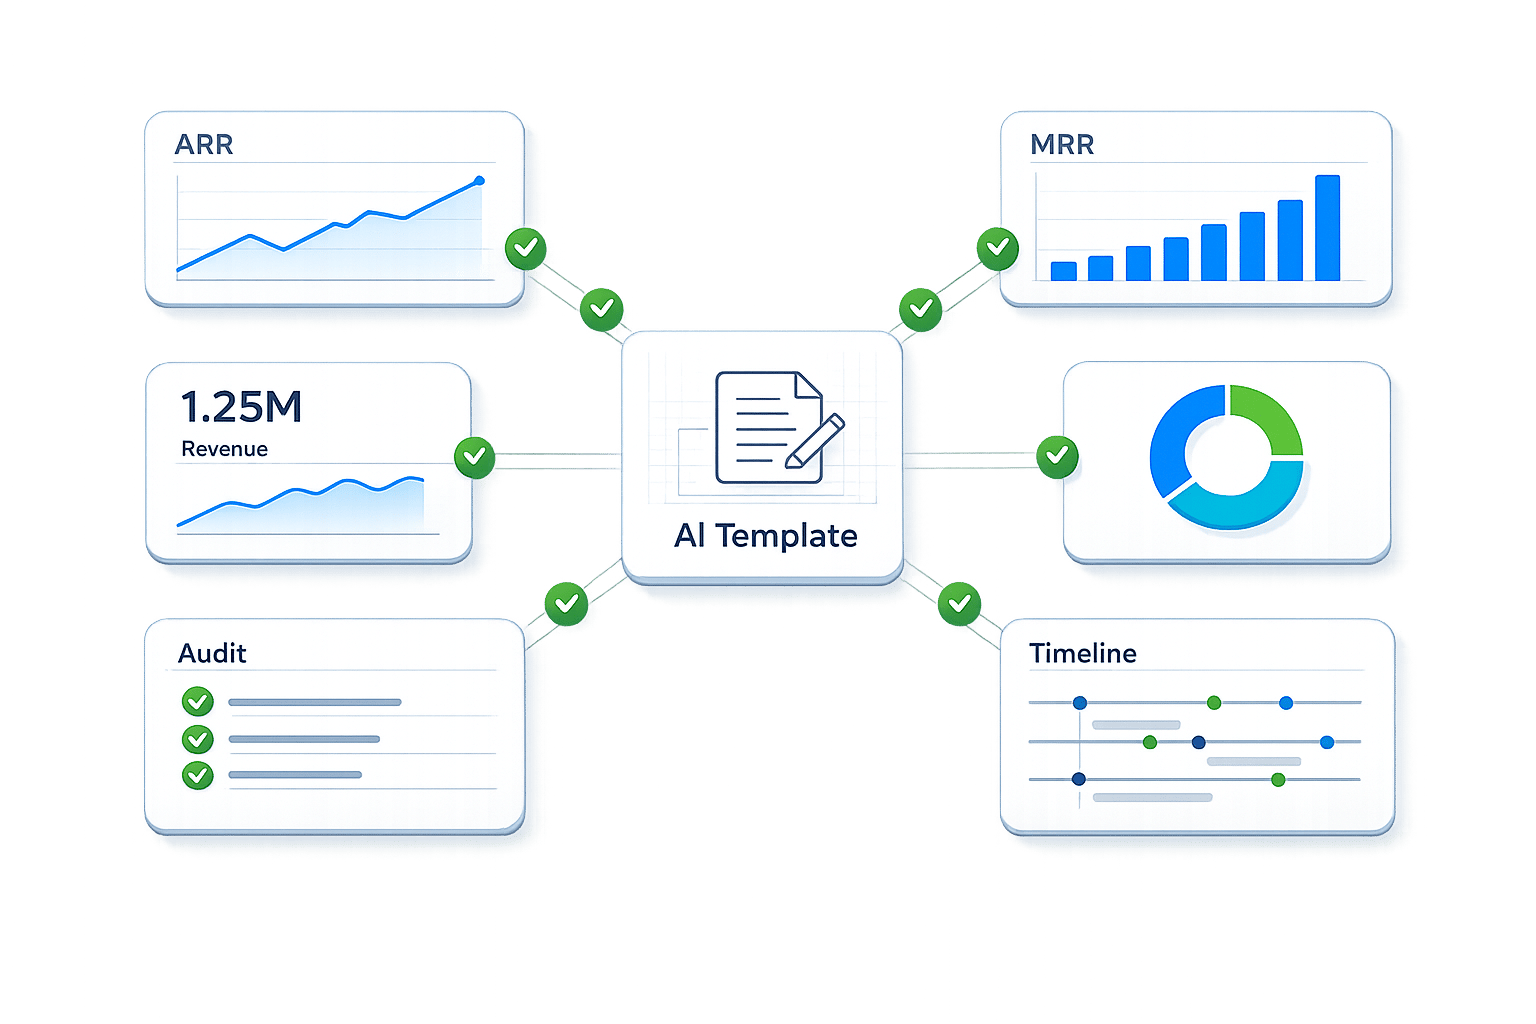
- Integrating insights: Align AI outputs with financial planning tools for actionable strategies.
Platforms like Lucid Financials simplify integration by combining market insights with accounting tools, enabling startups to act swiftly in dynamic markets.
Predicting human decisions with behavioural theories and machine learning
sbb-itb-17e8ec9
Define Your Behavioral Pattern Use Cases
Start by pinpointing the investor behaviors and financial decisions that matter most to your business. Don’t just focus on the data or algorithms you have - begin with your business goals. Ask yourself: What financial decisions need improvement? Whether it’s treasury management, timing fundraising efforts, managing risk, or planning liquidity, work backward to identify the behaviors and market trends that shape these decisions.
Identify Key Target Behaviors
Instead of trying to track everything, zero in on a few high-impact behavioral patterns. For most U.S. startups, three to five categories are enough to cover the essentials:
- Investor sentiment shifts: These are often revealed through news, earnings reports, and social media. Sentiment shifts help you spot changes in fundraising conditions and valuation trends.
- Trading anomalies: Look for unusual activity like volume spikes, price gaps, or imbalances in order books. These can signal liquidity issues or volatility events.
- Liquidity stress patterns: Indicators like widening bid-ask spreads, reduced order-book depth, or rising funding rates can reveal cash flow challenges or potential difficulties in exiting positions.
- Herding and crowding behavior: When too many investors focus on the same trades, tail risks increase. This insight can guide decisions on runway planning and risk management.
- Regime and volatility shifts: These help distinguish stable markets from stressed ones, providing guidance on when to scale spending, hire, or pull back.
Each idea needs to be turned into specific, observable signals your AI can track. For example, to monitor sentiment shifts, define your data sources - like U.S. financial news, SEC filings, and social media platforms - and calculate metrics such as sentiment scores, volatility, and rates of change for relevant sectors or tickers. Similarly, trading anomalies might be measured using volume z-scores (e.g., activity three standard deviations above the 90-day average), intraday price jumps, or unusual quote-to-trade ratios. For liquidity stress, set thresholds for bid-ask spreads, order-book depth in dollar terms, and gaps between realized and implied volatility. These behaviors can then be labeled into patterns, like a "liquidity stress event", which combines multiple indicators such as an elevated spread, reduced depth, and sustained volatility.
Once you’ve defined these patterns, tie each one directly to a financial action.
Map Patterns to Financial Decisions
Develop a clear "if pattern X, then action Y" framework and embed it into your financial planning and analysis (FP&A) processes. This ensures that every identified behavior leads to actionable strategies. For example:
- Capital allocation: When sentiment is positive and systemic stress is low, consider growth initiatives and increased capital allocation. On the flip side, crowded trades or overheated sentiment in your sector might signal it’s time to accelerate secondary sales or lock in favorable convertible note terms.
- Liquidity management: Signs of liquidity stress in U.S. credit or funding markets should prompt a shift toward high-quality, liquid USD instruments while reducing harder-to-exit exposures. In calmer markets, you might extend durations slightly or allocate a small portion to riskier yield products within preset limits.
- Runway planning: Negative sentiment and risk-off regimes should encourage extending your runway from 18 to 24 months, given slower fundraising conditions and more conservative valuations. Conversely, when conditions improve, plan to initiate fundraising early to secure favorable terms and build a cash buffer.
After mapping these behaviors to decisions, define the market conditions and outcomes that will validate your AI-driven insights.
Determine Market Scope and Outcomes
Clearly outline your timeframes, asset classes, and measurable goals. For example:
- Intraday patterns: Use tick or minute-level data for monitoring execution quality and liquidity risk if you’re actively trading or managing large treasury positions.
- Short-term patterns: Analyze data over days or weeks to capture swing trading opportunities, event-driven behaviors, or sentiment shocks.
- Medium- to long-term patterns: Focus on months or years to understand macro trends, risk-on/risk-off behaviors, and capital-raising windows.
Select the asset classes that matter most to your business, such as U.S. equities, ETFs, options, or USD-denominated credit relevant to your sector or treasury holdings. Set measurable goals like improving risk-adjusted returns, enhancing anomaly detection rates, reducing drawdowns, or sharpening cash-flow forecasts. A pattern is worth incorporating into your FP&A models if it significantly impacts cash flow, risk, valuation, or timing. Use backtests to confirm how often the pattern aligns with major events like drawdowns, liquidity squeezes, or successful fundraising outcomes.
Finally, focus only on patterns that allow actionable responses and remain consistent across various market conditions.
For startups with lean financial teams, platforms like Lucid Financials (https://lucid.now) can streamline this process. Lucid integrates AI-driven insights into cash-flow forecasts, board reports, and investor updates, ensuring your behavioral signals translate into actionable financial strategies instead of sitting idle in dashboards.
Build Your Data and Infrastructure Foundation
After identifying behavioral patterns and linking them to financial decisions, the next step is creating a solid technical framework to support AI-driven analysis. This involves choosing the right data sources, ensuring scalable storage and computing, and integrating these elements into your financial systems. Without this backbone, AI models may fall short in delivering insights. A well-constructed data infrastructure strengthens your "if pattern, then action" framework, turning behavioral use cases into practical outcomes.
Select and Prepare Data Sources
Start by pinpointing the data types that will fuel your behavioral models. Key sources include market microstructure data - like order book depth, bid-ask spreads, and tick-by-tick trades - which are crucial for detecting liquidity issues and trading anomalies in real time. Sentiment feeds from financial news, SEC filings, and social media platforms help monitor shifts in investor mood and crowding behaviors. Additionally, alternative data sources, such as credit card transaction volumes, web traffic, and even satellite imagery, can offer early indicators of economic trends.
However, raw data often needs cleaning and standardization. This involves tasks like removing duplicates, filling in gaps, and unifying formats. For example, timestamp mismatches across exchanges can distort intraday pattern analysis, so aligning all data to a single time zone (usually Eastern Time for U.S. markets) is critical. Automated pipelines can streamline data ingestion, validation, and transformation, ensuring your models rely on up-to-date, accurate information.
Set Up Scalable Storage and Computing
Your infrastructure must efficiently handle both real-time tick data and historical records. A tiered storage approach works well: use high-speed SSDs for "hot" data like recent trading activity, while archiving older "cold" data in cloud object storage solutions like AWS S3. This method allows for gradual capacity expansion as your data volume increases.
For computing, adopt systems that support dual execution models. For instance, platforms like MotherDuck let you test AI workflows locally using DuckDB before scaling to the cloud, reducing costs and preventing vendor lock-in. To maintain system speed, dedicate separate compute instances for heavy queries. Distributed frameworks like Apache Spark are ideal for processing vast amounts of financial data across multiple nodes. Security is equally important - encrypt data at rest with AWS Key Management Service (KMS) and secure data in transit using Transport Layer Security (TLS). Also, apply least-privilege access controls via Identity and Access Management (IAM) to limit user access to only the data they need.
"The challenge for a modern startup is to find a data platform that is secure, scalable, and cost-effective without demanding a dedicated team to manage it." - Aditya Somani, MotherDuck
For example, in October 2025, the SaaS company Definite transitioned its data warehouse from Snowflake to a self-hosted DuckDB-based setup. This shift, which leveraged open data formats and local-first workflows, led to a 70% drop in operational expenses.
Connect Financial Data with Behavioral Insights
Integrate behavioral signals with financial data to make informed decisions. Combine internal data - like transaction history, CRM records, and cash flow statements - with external feeds such as market prices, ETF coverage, and sentiment scores into a single platform. This consolidation eliminates data silos, ensuring AI models have a complete view of market behavior and your financial standing.
Tools like Lucid Financials (https://lucid.now) make this process easier by merging real-time financial data with behavioral insights. Instead of juggling separate dashboards for bookkeeping, cash flow projections, and market signals, you get a unified perspective. This setup links behavioral triggers to actionable financial strategies, embedding insights into both daily operations and long-term planning.
Deploy AI Models for Pattern Detection
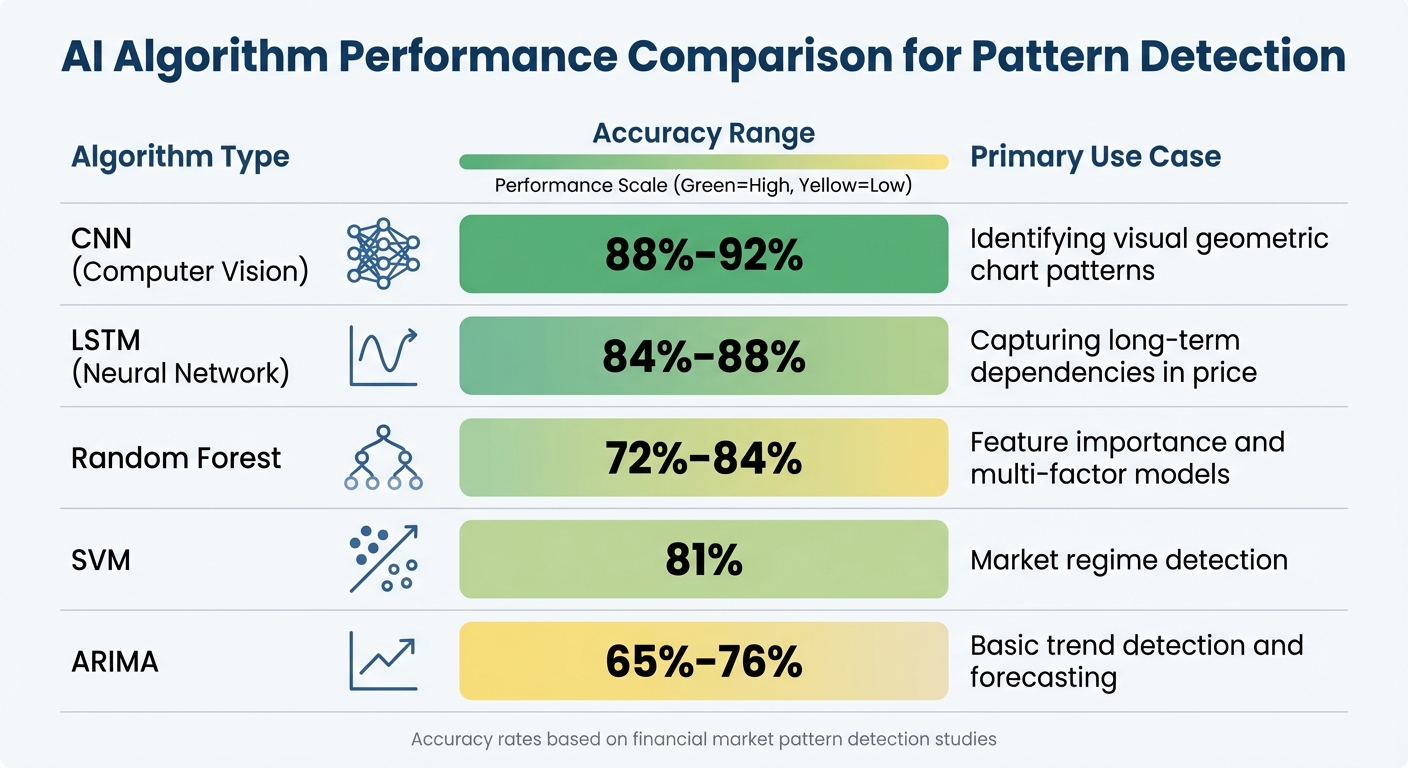
AI Algorithm Performance Comparison for Financial Pattern Detection
With a solid foundation of data and infrastructure, AI models can help you turn behavioral signals into actionable market insights. By selecting the right techniques, engineering key features, and keeping models updated, you can build systems that detect behavioral patterns in real time. Whether you’re spotting chart patterns, tracking sentiment shifts, or identifying anomalies, the process starts with choosing the right tools for the job.
Choose the Right AI Techniques
Different detection tasks require different AI methods. For example:
- Convolutional Neural Networks (CNNs) excel at recognizing visual chart patterns like head-and-shoulders or double bottoms, with accuracy rates between 88% and 92%.
- Long Short-Term Memory (LSTM) networks are ideal for capturing time-series dependencies in price movements, achieving accuracy levels of 84% to 88%.
- For tasks without predefined labels, unsupervised methods like k-means clustering can group similar behaviors effectively.
Sometimes, combining models yields better results than using a single one. Ensemble methods, such as blending Random Forests and Gradient Boosting, can reduce false positives by 30% and boost overall detection accuracy by 18%. For instance, in July 2025, Tickeron's High-Frequency Multi-Ticker AI Agent achieved an impressive annualized return of +273% by managing real-time pattern recognition and automated risk management across high-liquidity tickers like AAPL, NVDA, and TSLA.
| Algorithm Type | Accuracy in Pattern Detection | Primary Use Case |
|---|---|---|
| CNN (Computer Vision) | 88%–92% | Identifying visual geometric chart patterns |
| LSTM (Neural Network) | 84%–88% | Capturing long-term dependencies in price |
| Random Forest | 72%–84% | Feature importance and multi-factor models |
| SVM | 81% | Market regime detection |
| ARIMA | 65%–76% | Basic trend detection and forecasting |
Engineer Features for Behavioral Analysis
Feature engineering is key to helping AI models recognize behavioral signals more accurately. For example, order-flow imbalance - the difference between buy and sell pressure at specific price levels - can highlight institutional activity. Meanwhile, sentiment indices derived from Natural Language Processing (NLP) scans of financial news and social media can provide context during technical breakouts. Metrics like the Average True Range (ATR) can label volatility regimes, helping models adapt to calm or turbulent conditions.
An example of feature prioritization: during periods of high volatility, focus on volume and ATR over momentum indicators like RSI. Cross-signal validation can also improve accuracy; for instance, only accept bullish reversal patterns if the price is above the 120-day moving average (MA120). Between March 3 and April 3, 2025, the I Know First AI algorithm's "Aggressive Stocks Forecast" delivered an average return of 38.91% on short positions, outperforming the S&P 500 by 48.28% during a market downturn. Predictions included MULN (-96.91%) and WKHS (-75.83%).
Once features are refined, it’s crucial to monitor and update models to maintain their effectiveness.
Monitor and Update AI Models
The market is constantly changing, and AI models must adapt to stay effective. Monitoring key performance metrics is essential to detect model drift. Techniques like regime-switching models and Bayesian inference allow systems to adjust dynamically as new data comes in, making them better equipped to handle sudden shifts like flash crashes. Deep stochastic filters can also manage nonstationarity when market correlations or distributions shift unexpectedly.
"In 2026, the competition won't be on the AI models, but on the systems. The model itself is not going to be the main differentiator." - Gabe Goodhart, Chief Architect of AI Open Innovation, IBM
Regular retraining is critical, especially after major market events or structural changes. Use multiple random seeds during retraining to ensure results aren’t skewed by specific initializations. Before deploying updated models, validate them through paper trading to test their performance under current market conditions. To avoid surprises in production, route all library warnings - like convergence hints or numeric overflow - into a searchable logging system. These warnings often signal data drift or preprocessing issues that need attention.
Validate and Stress Test Your Models
Once you've tackled model deployment and feature engineering, the next essential step is validating your AI models. This isn't just a one-time task - it requires constant attention to catch potential issues before they impact real-world trading.
"If your dataset doesn't make the system uncomfortable, it's not a validation set. It's a marketing brochure." - FintorAI
Run Realistic Backtests
To simulate real trading, use walk-forward analysis. Here's how it works: train your model on a three-year in-sample period and then test it on a one-year out-of-sample period. Keep rolling both windows forward to mimic actual trading conditions. For this method to be effective, you'll need at least ten years of data or three full market cycles. This ensures your model is exposed to various market conditions, testing its resilience.
For example, a December 2025 study involving 100 US equities used a rolling window framework. The results? An annualized return of 0.55%, a Sharpe ratio of 0.33, a maximum drawdown of -2.76%, and a market-neutral beta of 0.058.
Don't forget to account for real-world trading costs like commissions, slippage, and trade size limits. Avoid look-ahead bias by only using data available at the time and executing trades on the next possible bar. Always benchmark your strategy against a simple "buy and hold" approach to confirm you're adding real value.
Evaluate Detection Performance
Once your backtesting framework is in place, shift your focus to assessing the model's consistency across different market environments. A strong model should hold up in both bull and bear markets, as well as during periods of high and low volatility. For instance, one validation study showed quarterly returns of 0.60% during high-volatility periods but dropped to -0.16% in more stable markets. If your out-of-sample Sharpe ratio falls more than 30% below the in-sample Sharpe ratio, overfitting is likely the culprit.
Feature stability analysis can help identify which behavioral signals remain reliable under changing conditions. To further refine validation, consider adding a "human layer" by accounting for factors like missed entries, fear-driven early exits, or manual overrides during volatile periods.
Conduct Stress and Scenario Tests
Stress testing is essential for determining whether your model can handle extreme scenarios that typical backtests might miss. Test your model against historical crises like 2008 or 2020, as well as synthetic scenarios such as a 30% flash crash or sudden oil price spikes. This helps assess potential risks that could arise in the future.
Monte Carlo simulations are another powerful tool. They allow you to measure ruin probabilities and worst-case drawdowns by running thousands of synthetic scenarios. Push your model further by doubling volatility to check for whipsaws or analyzing correlation breakdowns when diversification benefits disappear as correlations spike toward 1.0. Be sure to include datasets with delisted symbols and failed assets to eliminate survivorship bias.
"The edge isn't 'having a great strategy.' The edge is having a validation engine that keeps killing weak ones early." - FintorAI
Adopt a "traffic-light" scoring system to categorize your models: Green for those ready for capital allocation, Yellow for strategies needing hedging, and Red for fragile models that should be set aside. Before moving to live trading, conduct four to eight weeks of paper trading to verify that your execution edge holds up in real-time conditions.
These steps ensure that only the strongest, most reliable models make it to live deployment.
Set Up Governance and Financial Integration
Once AI insights have been validated and stress-tested, the next step is to build governance frameworks and workflows that integrate these insights into your financial operations. This process ensures AI outputs directly support actionable financial decisions.
Establish Model Governance and Ownership
Start by appointing a Chief AI Risk Officer to oversee all AI systems. This role ensures that model outputs align with your behavioral insights and financial goals. The officer should work closely with an AI Oversight Committee, which is responsible for reviewing high-risk applications and setting clear policies.
Implement a Three Lines of Defense model for accountability:
- First line: Business units take ownership of the models.
- Second line: Risk and compliance teams monitor these models.
- Third line: Internal audit teams validate the processes.
During model reviews, tools like SHAP values can provide transparency by identifying potential errors or issues with training data quality. This structure ensures that AI systems are both reliable and well-regulated.
Set Risk Controls and Guardrails
Establish strict risk limits tied to key financial metrics. Use real-time monitoring dashboards to track data drift indicators such as the Population Stability Index (PSI) or Kullback-Leibler (KL) divergence. These metrics help identify when your AI models deviate from their training data. For instance, if the PSI crosses a predefined threshold, an alert should be triggered for immediate human review.
"91% of organizations recognize they need to do more to reassure their customers that their data is being used only for intended and legitimate purposes in AI." - Cisco 2024 Data Privacy Benchmark Study
Set fallback mechanisms, such as a Human-in-the-Loop process, to validate anomalies when model confidence drops below acceptable levels. Allocate at least 30% of AI risk management resources to continuous monitoring after deployment. These measures ensure that AI-driven insights are both accurate and seamlessly integrated into financial workflows.
Link Insights to Financial Planning
With governance in place, the next step is to embed AI-driven behavioral insights into your financial planning tools. For example, AI signals can directly influence cash flow forecasts, budget adjustments, and other financial strategies. If your model detects market sentiment shifts, those insights should guide updates to your forecasts and budgets.
Platforms like Lucid Financials make this integration easier. Lucid’s AI-powered tools can automatically update runway projections and generate board-ready reports when significant market changes occur. For instance, if increased market volatility is detected, Lucid enables you to run what-if scenarios to assess the impact on cash reserves over the coming months. Automated alerts via Slack ensure your finance team is immediately informed when critical thresholds are crossed, allowing for faster, data-driven decisions without manual intervention.
Conclusion
Using AI for behavioral pattern recognition in financial markets demands a well-thought-out strategy that blends technical expertise with practical execution. Start by identifying clear use cases linked to measurable financial outcomes. Build a reliable data infrastructure and select AI techniques that suit your startup's goals - whether it's machine learning for portfolio optimization or natural language processing to gauge sentiment.
The potential of AI in this space is backed by data. For instance, AI models trained on a decade of historical stock market data have reached 85% accuracy in predicting trends, with precision rates of 80% and recall of 78%. These systems can also execute transactions at speeds far beyond human capabilities, taking advantage of subtle market movements. However, while these results are impressive, it’s crucial to stay mindful of the technology’s limitations.
AI is exceptional at processing large volumes of data quickly but struggles with biases in data and lacks the intuitive judgment humans bring to the table. The best results often come from combining AI-driven insights with human expertise, especially when navigating unpredictable market events. By following a structured approach, startups can harness AI for behavioral insights while maintaining strong governance and risk management.
For seamless integration, it’s essential to connect AI-generated insights directly to financial planning workflows. This includes updating cash flow forecasts, refining budgets, and guiding strategic decisions. Tools like Lucid Financials simplify this process by offering AI-powered accounting paired with real-time reporting. With features like instant alerts and integrated reporting, Lucid Financials enables teams to act quickly on AI-driven signals, ensuring investor-ready reports in just seven days. This frees up your team to focus on interpreting patterns and making strategic calls while the platform handles the heavy lifting.
The financial sector is increasingly adopting hybrid AI models that combine multiple machine learning techniques and reinforcement learning for continuous improvement. Startups that integrate these systems thoughtfully - backed by solid governance, risk controls, and human validation - can make faster, smarter decisions in volatile markets. Aligning these insights with your financial planning and analysis processes ensures your business stays agile and data-driven.
FAQs
What data is needed to detect investor sentiment shifts?
To track changes in investor sentiment, it's essential to gather data from a variety of sources that reflect market opinions and psychological trends. These sources include news articles, social media conversations, earnings call transcripts, and official press releases. Each provides unique insights into how investors feel and react.
Once collected, this data is analyzed using Natural Language Processing (NLP). NLP assigns sentiment scores on a scale from -1 (negative) to +1 (positive). These scores make it easier to spot patterns and shifts in sentiment across different channels. By doing this, you can better understand the mood of the market and its potential impact.
How do I turn AI signals into FP&A actions?
To turn AI insights into actionable steps for FP&A, start by using AI tools to process real-time data, spot anomalies, and create forecasts. These insights can help you fine-tune budgets, shift resources, or revise predictions as needed. Additionally, incorporate scenario modeling and behavioral insights to counter biases such as overconfidence or recency bias. This ensures that decisions are grounded in data and support long-term objectives. With this approach, financial planning becomes more adaptable and responsive to evolving market trends.
How do I prevent model drift in changing markets?
Preventing model drift hinges on two key practices: real-time monitoring and adaptive retraining. It's important to keep an eye on different types of drift, including:
- Data drift: Changes in the input data distribution.
- Concept drift: Shifts in the relationship between variables and outcomes.
- Covariate drift: Variations in features or specific segments.
Drift detection tools can help spot these issues early, allowing you to retrain models with updated data before performance takes a hit. Setting up regular evaluations and automated alerts for major changes ensures your models stay accurate and aligned with evolving market conditions.