I’d use customer profiles to predict churn only if they improve results beyond account and behavior data. My first step: compare models with and without profile details on the same untouched test data. IBM’s 7,043-record telecom dataset can help test methods - but it cannot tell you whether a model works for patients.
Here’s what I’d check before using churn scores:
- Prediction quality: Test future periods, prevent data leakage, and check whether predicted risks match actual departure rates.
- Explanations and bias: Use SHAP to explain scores - not causes - and compare errors across patient groups.
- Patient safeguards: Define disengagement for each care pathway, protect patient data, and never use scores to deny needed care.
- Outreach and budgets: Test whether outreach improves retention, then use local results and net collections to estimate revenue at risk and staffing needs.
My rule: <u>validate locally before acting</u>. A churn score is a planning input - not proof that someone will leave or that outreach will keep them.
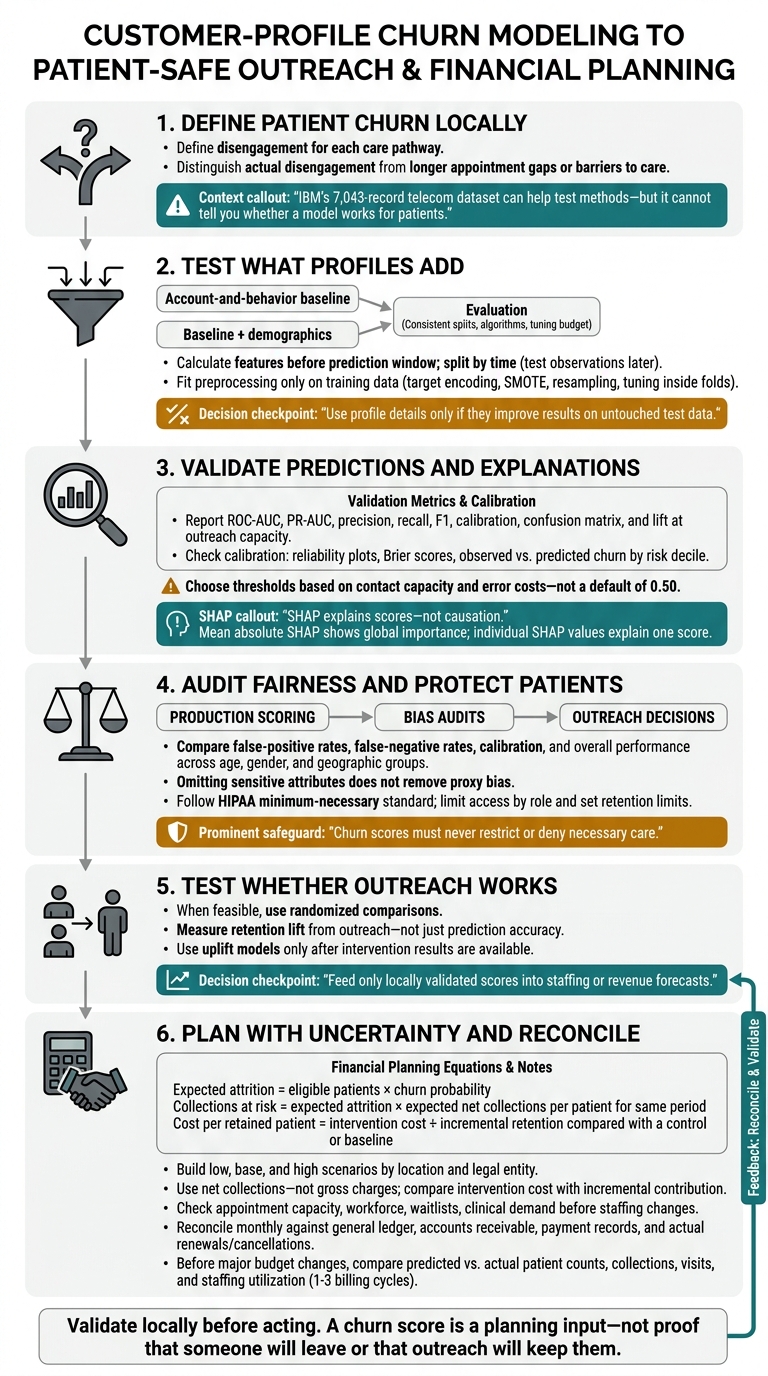
AI Churn Prediction: From Validation to Patient-Safe Planning
What Customer Profiles Add to Churn Models
Demographics Compared With Account and Behavior Data
Demographic features earn their place only when they improve validation performance beyond account and behavior data. A ZIP code, for example, may reflect service access rather than loyalty.
| Feature category | Examples | Engineering methods | Predictive meaning | Limitations |
|---|---|---|---|---|
| Demographic | Age, gender, geography, household status | One-hot encoding, binning, geographic grouping | Life stage, stability | May proxy service access |
| Account and financial | Contract, tenure, monthly charges | Scaling, log transforms, charge-to-tenure ratio | Price sensitivity, loyalty | Tenure can dominate the signal and hide weaker effects |
| Behavioral | Usage, logins, feature adoption | Recency/frequency, trend slopes | Engagement | Requires frequent updates |
| Customer service | Tickets, complaint sentiment | Counts, sentiment scoring, resolution time | Friction, dissatisfaction | Observed only in customers who contact support |
A higher churn rate in one age group shows association, not causation.
Feature Engineering and Tests of Added Value
Use one-hot encoding for categories with few possible values, such as gender or broad region. For fields with many possible values, use target encoding within cross-validation folds. This keeps validation outcomes from influencing the encoding. Binning age and tenure can help model non-linear relationships with churn. Fit imputation, scaling, and encoding only on training data, using a pipeline.
Calculate every feature from a snapshot taken before the prediction window. Then split the data by time so the test uses later observations.
Compare an account-and-behavior baseline against a model that adds demographics. Keep the splits, algorithms, tuning budget, and evaluation method the same. Report changes in AUC-ROC or F1-score; consistent gains support added predictive value.
Next, test whether that lift holds up across cross-validation and out-of-time testing.
sbb-itb-17e8ec9
How Studies Test Churn Models
Model Types, Metrics, and Validation
After feature selection, check whether the added signal holds up under strict validation. Use the same validation pipeline for every model to see whether profile features improve holdout performance - not just training fit. No model wins on every dataset.
The reported ROC-AUC values below are close, so uncertainty matters.
| Model | Strengths | Limitations | Interpretability | Example ROC-AUC / F1 |
|---|---|---|---|---|
| Logistic regression | Fast, transparent baseline | Can miss nonlinear effects | High | ROC-AUC: 0.835; F1: 0.593 |
| Random forest | Models interactions and nonlinear patterns | Probabilities may need calibration | Medium; explanation tools needed | ROC-AUC: 0.829 |
| XGBoost | Effective on structured data | Requires careful tuning | Medium with SHAP | ROC-AUC: 0.833 |
| Support vector machine | Useful for high-dimensional data | Scaling matters; can be slow at scale | Low to medium | - |
| Neural network | Models nonlinear relationships | Needs more data and tuning | Low without explanation tools | - |
| Voting or stacked ensemble | Can combine complementary errors | Harder to audit and calibrate | Low to medium | - |
Accuracy tells you little when churn is rare; precision-recall measures are especially useful. Report ROC-AUC, PR-AUC, precision, recall, F1, calibration, a confusion matrix, and lift at outreach capacity. Don't infer unreported metrics from ROC-AUC.
Check calibration at the churn rate expected in production. Use reliability plots, Brier scores, and observed versus predicted churn by risk decile. Fit calibration without using the final test set.
Choose thresholds based on contact capacity and error costs rather than defaulting to 0.50. Report geographic or population holdouts separately, including sample size, churn prevalence, and false-positive and false-negative rates.
Keep SMOTE and all resampling inside training folds, along with preprocessing, hyperparameter tuning, and model selection. Never rebalance the test set.
What SHAP Explains - and What It Does Not
Performance metrics show how well a model predicts. SHAP shows which inputs drive its scores. Verify performance before interpreting those drivers.
SHAP assigns feature contributions relative to a baseline model output. Positive values push the churn prediction higher; negative values push it lower. Mean absolute SHAP shows global importance; individual SHAP values explain one score.
Common drivers include tenure, contract type, and charges.
These rankings describe the fitted model, not general behavior. They show what the model used - not what caused churn.
Correlated inputs can split or shift attribution. Check whether explanations stay stable across resamples, background datasets, and model versions. Compare SHAP with permutation importance and disclose correlated inputs.
SHAP does not prove causation. Use it to explain predictions, not to design interventions; test interventions separately.
Privacy, Bias, and Local Testing
Keep Scoring, Bias Audits, and Outreach Separate
Once a model performs well, test whether it treats the populations it will serve fairly and safely. Demographic data can improve predictions, but it can also lead to unequal error rates and misdirected outreach.
Keep production scoring, bias audits, and outreach decisions separate. When sensitive attributes aren’t used for scoring, store them in a separate audit dataset with controlled access. Leaving those attributes out of scoring doesn’t remove proxy bias. ZIP codes, visit frequency, and care settings can still reflect protected characteristics.
Compare false-positive rates, false-negative rates, calibration, and overall performance across age, gender, and geographic groups. Use the findings to review who receives support - not to justify withholding it. Churn scores must never restrict or deny necessary care.
Protect Patient Data and Test Outreach Results
Test retail or service-industry findings locally before applying them to patients. Check that churn labels reflect actual disengagement rather than longer gaps between appointments or barriers to care. Monitor drift by location and site so changes in local service availability don’t distort scores.
Use only the data the task requires. Follow the HIPAA minimum-necessary standard where it applies, limit access by role, and set retention limits so outdated risk profiles don’t drive outreach.
When feasible, test outreach through randomized comparisons. Measure the retention lift from outreach, not just prediction accuracy. Use uplift models only after intervention results are available, and feed only locally validated scores into staffing or revenue forecasts.
Using Churn Estimates in Financial Planning
Estimate Revenue at Risk and Staffing Needs
Once churn scores are validated, turn them into financial scenarios. Use locally validated churn estimates as planning inputs, not booked losses. Calculate expected attrition as eligible patients × churn probability. Then multiply that result by expected net collections per patient for the same period - not gross charges - to estimate collections at risk. Build low, base, and high scenarios for each location and legal entity, accounting for payer mix, replacement patients, and payment timing.
Use the same locally validated scores to estimate patient lifetime value based on future net collections, retention length, costs, and discounting. Calculate cost per retained patient by dividing intervention cost by incremental retention compared with a control or baseline. Compare that cost with incremental contribution, not billed revenue. Monthly recurring revenue applies only to subscription or membership models. For fee-for-service planning, track visits and net collections instead.
Test whether staffing and capacity can absorb the expected loss under each scenario. Before changing staffing or expansion plans, check each scenario against appointment capacity, workforce availability, waitlists, and clinical demand.
Check Forecasts Against Financial Records
Reconcile forecasts with actual financial results each month, using the general ledger, accounts receivable, payment records, and actual renewals or cancellations. Before making major budget changes, compare predicted and actual patient counts, collections, visits, and staffing utilization over one to three billing cycles.
Review each location and entity separately so overhead, intercompany activity, and payer timing don't get mistaken for churn.
Comprehensive Guide to Building a Customer Churn Prediction Model from Start to Finish
Conclusion: What Churn Research Supports
Research points to a consistent rule: demographic and profile features help only when they outperform an account-and-behavior baseline on untouched test data. Exclude information collected after the cutoff, and report calibration alongside ranking accuracy.
Use access controls and retention limits to protect profile data. Audit error rates and calibration across subgroups. SHAP explains scores - not causation. To measure how much outreach improves retention, test it with randomized holdouts.
For patient use, local validation matters more than public benchmark scores. Those scores don’t establish whether a model fits patient care. Define patient churn locally, validate the model on the relevant patient population, and have clinicians review outcomes. Use locally tested estimates with explicit uncertainty for financial planning; don’t assume benchmark performance will transfer.
FAQs
How much local data do I need to predict patient churn?
Aim for 6–12 months of historical data from at least 500 customers. Some advanced models may need 12–18 months of consistent data to produce reliable forecasts.
Bring high-quality data from your CRM, product analytics, support platforms, and billing systems into one place. If your startup has limited history, focus on clean, organized records. For modern AI algorithms, data quality often matters more than volume.
How often should I retrain my churn model?
Retrain your churn model monthly with new churn outcomes, and update predictions automatically - ideally every night. If accuracy falls below 75%, retrain sooner with the latest data to help prevent model drift as customer behavior changes.
How can I distinguish patient churn from a planned care gap?
Track behavior over time instead of relying on snapshots. Patients with a planned gap in care remain engaged. Signs of churn include fewer logins, less use of core features, or a more negative tone in support communications.
AI models can flag changes from each patient’s usual patterns. Combining transaction data, behavior, and sentiment helps separate a scheduled care gap from early signs of disengagement.